Contract management statistics point to one problem: most organizations sign agreements and then lose track of them. The signature is the easy part. The money moves, or leaks, in the months after it.
This page collects primary data on that gap. It covers how long contracts take, how much value they lose, what better management returns, who uses software for it, and how big the software market is. Every number links to the group that published it, with the date of the data.
If you run a small business or work for yourself, treat the large-company figures as a ceiling, not a forecast. The patterns are the same at any size: scattered files, manual date tracking and terms nobody reads twice.
Key Takeaways
- Average contract value erosion is 8.6%, with the best performers at a little over 3% and the worst above 20%. (WorldCC, Jun 2026).
- Poor agreement management costs organizations nearly $2 trillion in global economic value each year. (Deloitte and Docusign, May 2024).
- Procurement contracts lose 11% of their value on average. (WorldCC, Jan 2026).
- Only 39% of commercial practitioners believe their contracts deliver the outcome they were meant to. (WorldCC, Aug 2025).
- Contract data sits in 24 different systems on average. (WorldCC, Aug 2025).
- Organizations can realistically recover 2 to 3% of spend in year one and 5 to 10% over a three-year program. (WorldCC, Jan 2026).
- A Forrester study found a composite organization earned a 449% ROI from Docusign CLM. (Forrester TEI for Docusign, Oct 2024).
- The average time to execute a contract is 35 days, and mid-market companies got it down to 32. (Ironclad, May 2026).
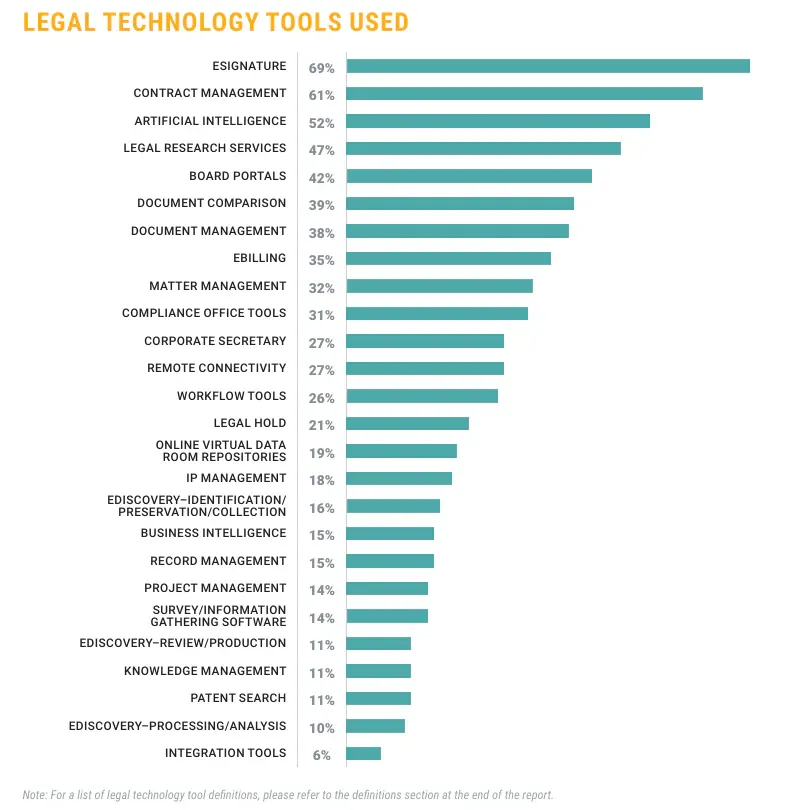
- 61% of legal departments use contract management tools. (ACC, Jun 2025).
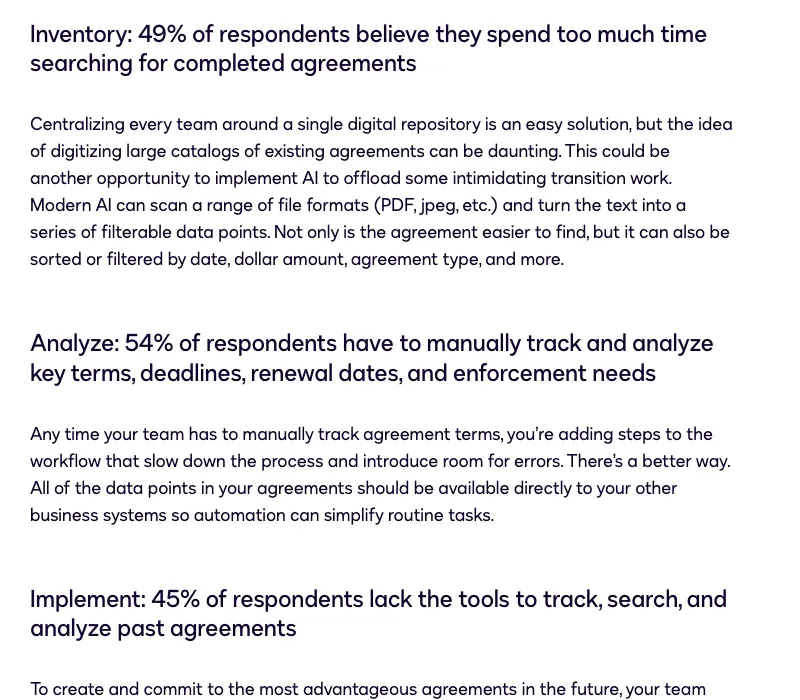
- 54% of business leaders manually track key terms, deadlines and renewal dates. (Deloitte and Docusign, May 2024).
- 37% of general counsel report low confidence in using advanced contract analytics. (Gartner, Oct 2025).
- More than 25,000 Docusign customers use its agreement management platform, according to its fiscal 2026 annual filing. (Docusign Form 10-K, Mar 2026).
- Research firms put the 2025 contract lifecycle management software market at anywhere from $1.24 billion to $17.43 billion. (Global Market Insights, Mar 2025) (Verified Market Research, Aug 2026)
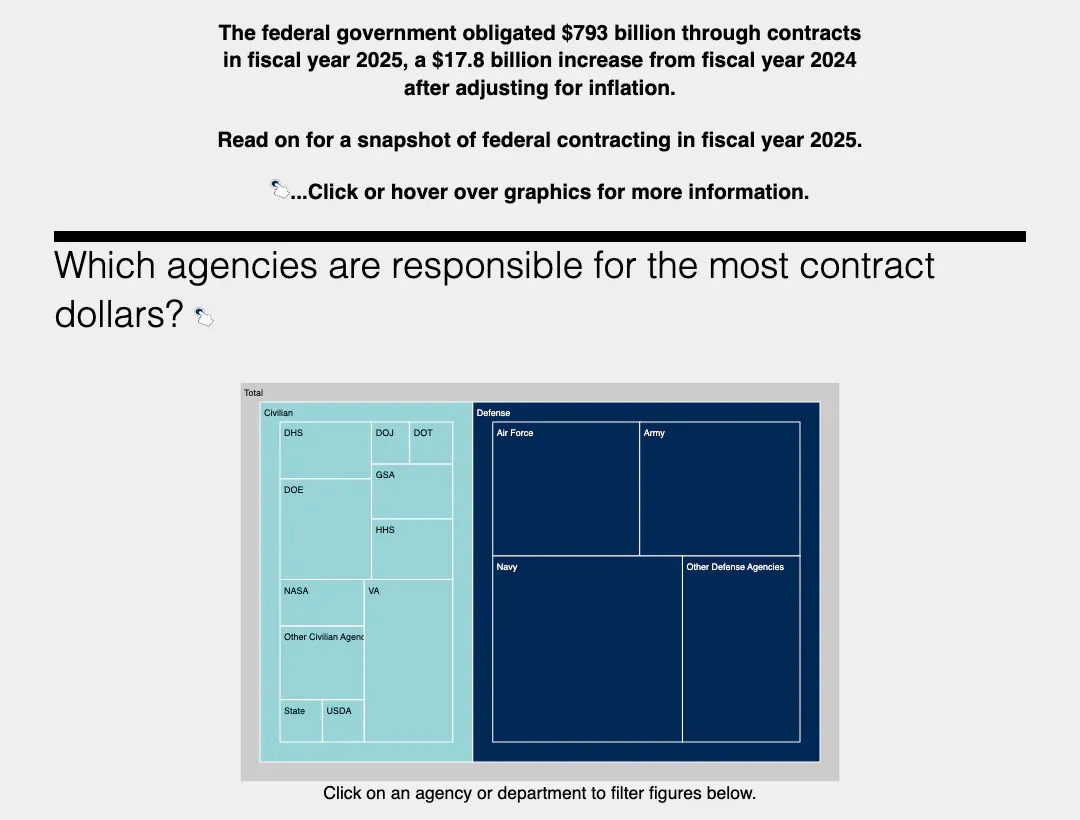
- The federal government obligated $793 billion through contracts in fiscal year 2025. (GAO, Apr 2026).
How Long Do Contracts Take, and How Much Work Is There?
Speed is the least equal number in contracting. A simple NDA clears in days, a services agreement takes weeks, and the fastest teams run several times quicker than the slowest. Most of the gap comes from handoffs and waiting, not from the legal text.
How fast do contracts get signed?
- From 2024 to 2025, the average days to execute a contract fell 5% (Ironclad, Sep 2026).
- Over the same period, legal involvement in contracts fell 6% (Ironclad, Sep 2026).
- Counterparty paper usage, where the other side’s template is used, dropped 4% (Ironclad, Sep 2026).
- A typical NDA takes about 5 days to execute with 30% legal involvement (Ironclad, May 2026).
- A complex master services agreement takes about 50 days and needs 85% legal involvement (Ironclad, May 2026).
- The best performers run contract cycles almost 4 times faster than the worst (WorldCC, Aug 2025).
How does cycle time differ by industry?
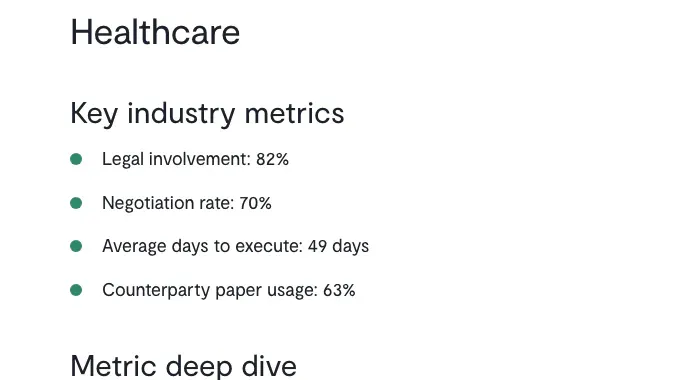
- Healthcare contracts take 49 days to execute on average (Ironclad, Feb 2025).
- Manufacturing contracts take 41 days (Ironclad, Feb 2025).
- Technology contracts take 38 days (Ironclad, Feb 2025).
- Transportation contracts take 40 days (Ironclad, Mar 2025).
- Communication contracts take 38 days (Ironclad, Mar 2025).
- Retail and consumer goods contracts take 37 days (Ironclad, Mar 2025).
- Manufacturers send 62% of contracts through legal, against 82% in healthcare (Ironclad, Feb 2025).
Where do contracts get stuck?
- An agreement can go through 15 or more internal handoffs before any negotiation with the other side starts (Deloitte and Docusign, May 2024).
- 62% of respondents struggle to locate and access previously approved contracts to use as a reference (Deloitte and Docusign, May 2024).
- 45% have to manually add information to contracts that already exist in their systems (Deloitte and Docusign, May 2024).
- 50% face repetitive legal and compliance approval steps (Deloitte and Docusign, May 2024).
- 34% have to manually read and interpret the impact of terms during negotiation (Deloitte and Docusign, May 2024).
- 52% wait on identity and notary checks that put deal closure at risk (Deloitte and Docusign, May 2024).
How much contract work lands on one person?
- More than half of surveyed executives personally review and approve over 500 contracts a year, and one in five put that above 1,000 (Icertis, Jun 2025).
- 40% of those executives spend 10 hours or more a week on contracts (Icertis, Jun 2025).
- 40% of small and mid-sized companies enter contracts with big businesses more than ten times a year (WorldCC, Oct 2024).
- In one case study, adopting market norms for standard terms cut the time spent negotiating by 68% (WorldCC, Oct 2024).
- A business services company raised customer acceptance of its standard contract from 10% to 70% (WorldCC, Oct 2024).
How Much Value Do Contracts Lose After Signature?
Value leaks in small amounts across many steps, which is why nobody owns the loss. The totals are large enough that a modest fix pays for itself, and the same causes show up at every company size.
How big is the loss?
- WorldCC’s 2014 research put average value erosion at 9.2% of contract value (Deloitte, Sep 2023).
- In more complex industries the loss is often 15% or more (WorldCC, Aug 2025).
- Contracting costs and value loss together are 2 to 4% of revenue at an average consumer goods company (Deloitte, Sep 2023).
- That combined figure rises to 15% or more in sectors that run high-value capital projects (Deloitte, Sep 2023).
- After signing, businesses lose an average of 9% of an agreement’s overall value (Icertis, Nov 2024).
Where does the lost value go?
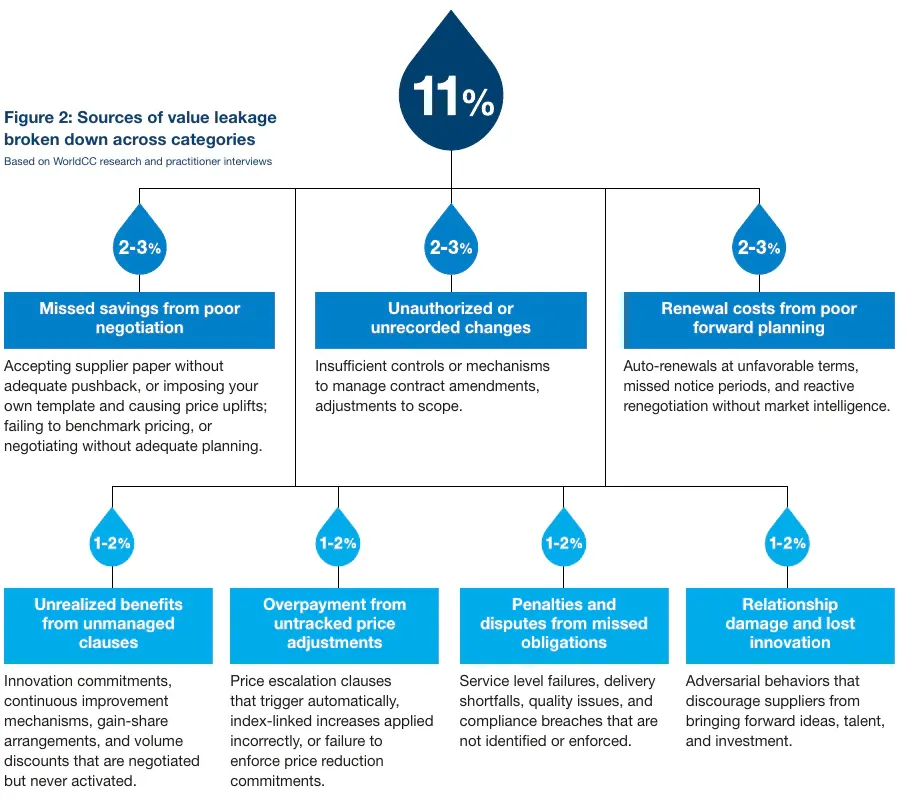
- Missed savings from poor negotiation cost 2 to 3% of contract value (WorldCC, Jan 2026).
- Unauthorized or unrecorded changes cost another 2 to 3% (WorldCC, Jan 2026).
- Unmanaged clauses, untracked price adjustments and damaged supplier relationships cost 1 to 2% each (WorldCC, Jan 2026).
- A company with $500 million in contracted spend and average practices may lose up to $15 million a year to preventable leakage (WorldCC, Jan 2026).
- A company with the same spend and a more complex business model will likely lose $75 million or more (WorldCC, Jan 2026).
Unclear scope and changes nobody wrote down are the leaks a small business can close first. A written agreement with a clear scope of work gives both sides something to check changes against.
What does it cost in time and relationships?
- Companies spend an extra 18% of their time on agreements because of disconnected workflows (Deloitte and Docusign, May 2024).
- That extra effort adds up to more than 55 billion hours wasted worldwide each year (Deloitte and Docusign, May 2024).
- Customer-facing functions such as sales and marketing carry 40% of the global value loss, while support functions carry 60% (Deloitte and Docusign, May 2024).
- 48% of businesses said customer relationships got significantly worse because of agreement delays (Deloitte and Docusign, May 2024).
- 66% said inefficient agreement workflows drive negative customer satisfaction (Deloitte and Docusign, May 2024).
Do executives see the leak?
- 90% of CEOs and over 80% of CFOs believe they leave money on the table in contract negotiations (Icertis, Nov 2024).
- 44% of CFOs name missed chances to charge additional fees as a top source of revenue leakage (Icertis, Nov 2024).
- 40% of CFOs name late or outstanding customer payments, and 40% name unused supplier discounts (Icertis, Nov 2024).
- 70% of CFOs cite inflation-driven cost increases as a top source of revenue leakage (Icertis, Nov 2024).
- More than 40% of the C-suite says their business does not use inflationary pricing protections in contracts (Icertis, Nov 2024).
- 82% of CFOs agree that contract negotiations do not produce the value they should (Icertis, Mar 2025).
What Cost Savings and ROI Does Contract Management Deliver?
The returns on paper are large, but read them with care. Most come from studies a vendor paid for, built on a composite company, so they show what a good rollout can do and not what the average buyer gets.
What ROI do Forrester studies report for CLM software?
- Docusign CLM customers cut the time spent generating a new sales contract by 90% (Forrester TEI for Docusign, Oct 2024).
- Procurement teams reported an 80% drop in labor costs spent researching business terms for vendor contracts (Forrester TEI for Docusign, Oct 2024).
- Docusign CLM customers reported an 85% reduction in errors (Forrester TEI for Docusign, Oct 2024).
- A composite organization using Ironclad earned a three-year ROI of 314% (Forrester TEI for Ironclad, May 2023).
- The same study found a 65% lift in end-to-end contract efficiency (Forrester TEI for Ironclad, May 2023).
- It also found a 60% lift in operational efficiency for legal teams (Forrester TEI for Ironclad, May 2023).
- It estimated benefits with a present value of $4.86 million and a 25 basis-point profit margin expansion (Forrester TEI for Ironclad, May 2023).
- A 3% conversion lift came from Ironclad’s clickwrap tool (Forrester TEI for Ironclad, May 2023).
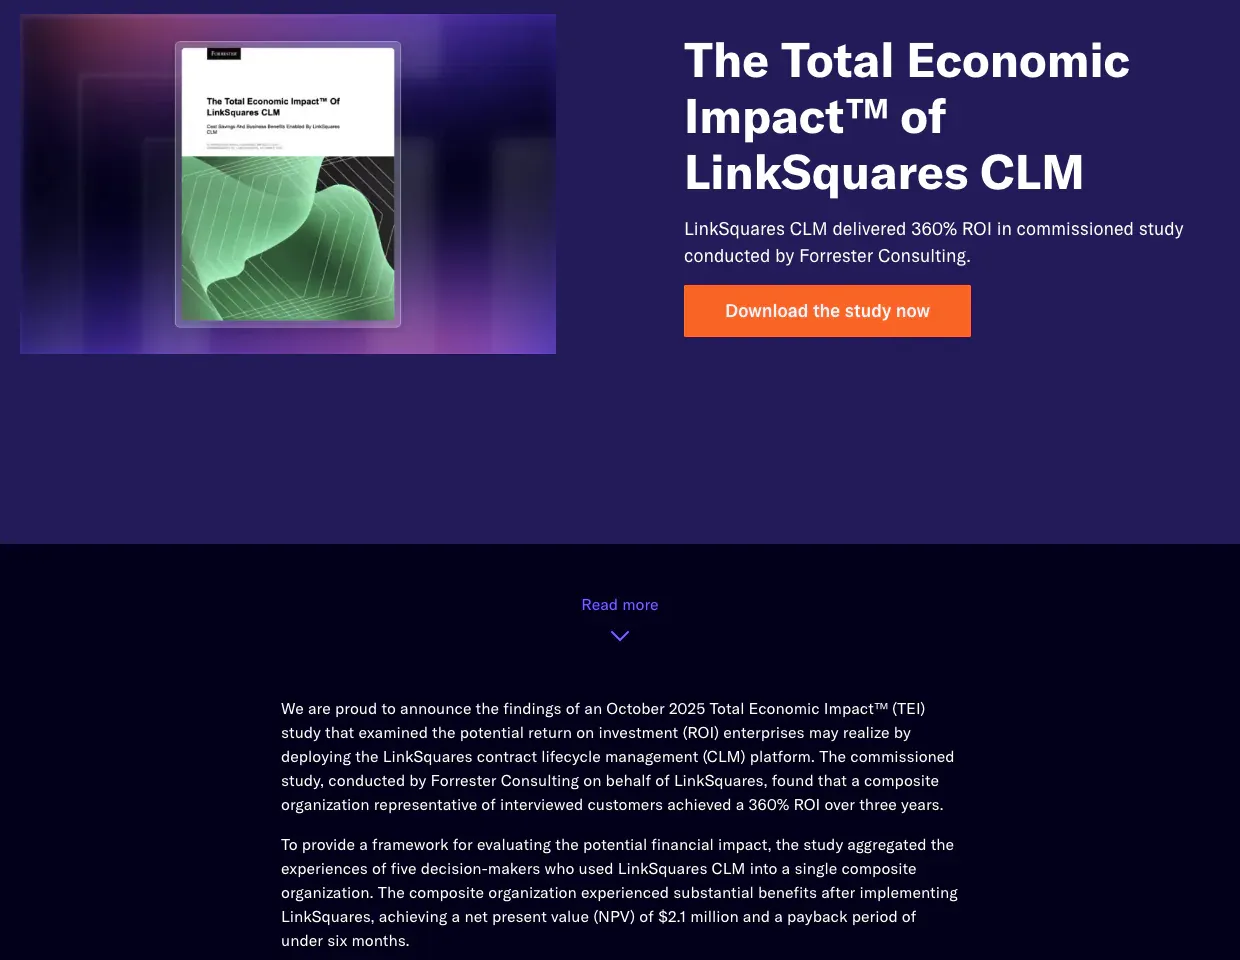
- The LinkSquares study found a net present value of $2.1 million for a composite organization (Forrester TEI for LinkSquares, Oct 2025).
- It found a 360% ROI over three years (Forrester TEI for LinkSquares, Oct 2025).
How much do better contract habits recover?
- Organizations that treat contracts as financial intelligence outperform peers by an average of 5.4% of contract value (WorldCC, Sep 2025).
- 48% of organizations that invested in contracting named better contract data visibility as a key benefit (Deloitte, Sep 2023).
- 40% of those investing have up-skilled existing staff, and 28% have brought in new people or skills (Deloitte, Sep 2023).
- Gartner predicted that by 2025 corporate legal departments would capture only 30% of the potential benefit of their CLM investments (Gartner, Feb 2020).
- Legal technology spending rose from 2.6% of in-house budgets in 2017 to 3.9% in 2020 (Gartner, Feb 2020).
- Gartner expected that share to reach about 12% by 2025 (Gartner, Feb 2020).
- Cutting legal involvement from 40% to 30% on 1,000 contracts a month removes about 100 reviews, roughly $40,000 of legal capacity each month (Ironclad, May 2026).
What do large buyers save by managing contracts and spend?
- Leading private sector companies use category management to save 10 to 20% on goods and services (GAO, Sep 2025).
- GSA reports the federal government avoided $58.3 billion in costs through category management from fiscal years 2021 through 2024 (GAO, Sep 2025).
- OMB announced more than $100 billion in savings and cost avoidance since the federal category management effort began (GAO, Sep 2025).
- Improvements in DOD contract management have produced about $50.9 billion in financial benefits since 1992 (GAO, Feb 2025).
- Category management alone has saved DOD and other agencies more than $48 billion (GAO, Feb 2025).
- Progress on GAO’s High Risk List has led to about $759 billion in savings over time (GAO, Feb 2025).
How Many Organizations Use Contract Management Software?
Most legal teams now have a tool, but having one is not the same as using it well. The next step for many is joining the data they already have.
Does company size change who uses contract management tools?
- The report draws on 395 legal departments across 23 industries and 34 countries (ACC, Jun 2025).
- 56% of departments at companies under $1 billion in revenue use contract management tools (ACC, Jun 2025).
- 66% of departments at companies with $1 billion to under $5 billion in revenue use them (ACC, Jun 2025).
- 68% of departments at companies with $5 billion to under $20 billion in revenue use them (ACC, Jun 2025).
- 66% of departments at companies with $20 billion or more in revenue use them (ACC, Jun 2025).
Is demand for agreement software still growing?
- Customers on its agreement management platform made up 10.8% of annual recurring revenue at the end of fiscal 2026 (Docusign Form 10-K, Mar 2026).
- That share was 2.3% a year earlier (Docusign Form 10-K, Mar 2026).
- 2 out of 5 companies want smarter agreement management capabilities (Deloitte and Docusign, May 2024).
- More than half plan to raise spending on agreement management over the next three years (Deloitte and Docusign, May 2024).
- Only 38% of surveyed leaders describe their CLM maturity as integrated (Conga, Jun 2026).
- That survey covered 250 senior leaders across legal, revenue, compliance and procurement (Conga, Jun 2026).
How Big Is the Contract Lifecycle Management Market?
Pick any number between $1 billion and $17 billion and some research firm has published it. The gap comes from scope: some count only core CLM software, others add services, analytics and signing tools. Compare growth rates before you compare dollars.
What is the market worth now?
- Mordor Intelligence puts the CLM software market at $3.0 billion in 2025 (Mordor Intelligence, Jan 2026).
- IMARC Group puts it at $2.6 billion in 2025 (IMARC Group, Oct 2026).
- Precedence Research puts it at $2.96 billion in 2025 (Precedence Research, Feb 2026).
- Straits Research sizes the broader contract management software market at $3.34 billion in 2025 (Straits Research, Sep 2026).
- Mordor Intelligence sizes that broader market at $3.48 billion in 2025 (Mordor Intelligence, Sep 2026).
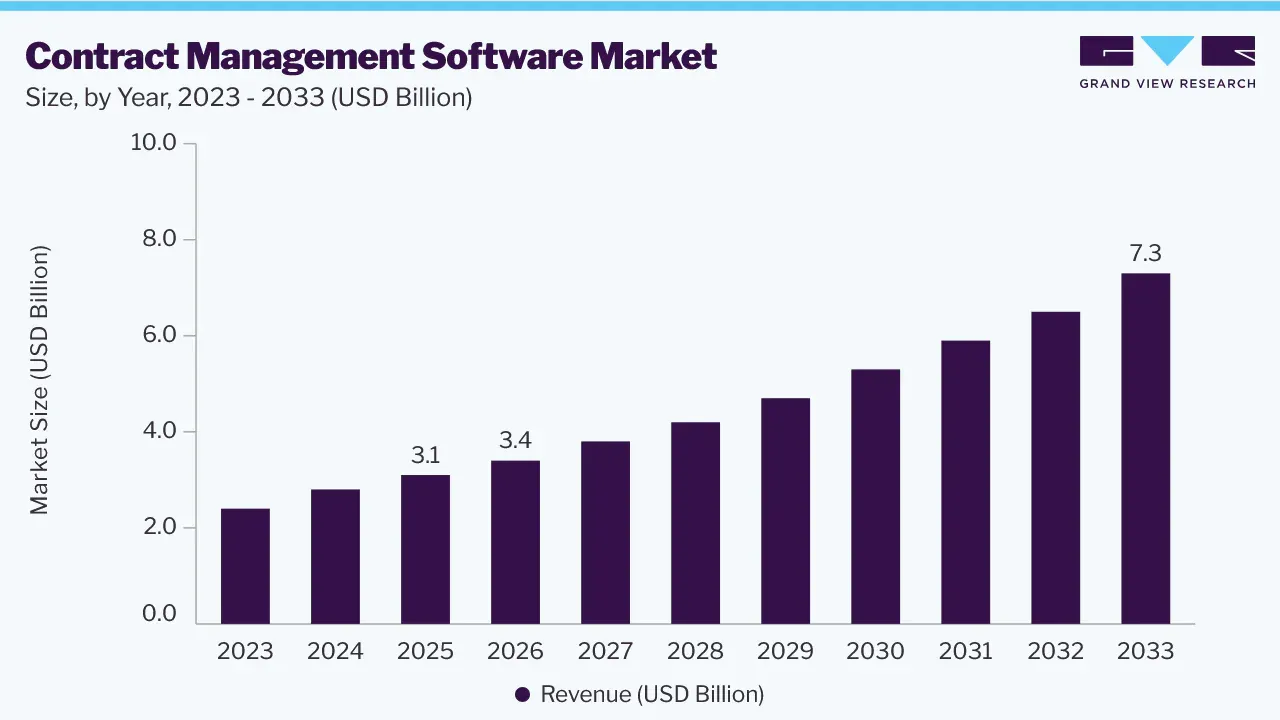
- Grand View Research valued the contract management software market at $3.1 billion in 2025 (Grand View Research, Oct 2026).
How fast is it expected to grow?
- Verified Market Research projects $47.33 billion by 2033, a 13.0% annual growth rate (Verified Market Research, Aug 2026).
- Global Market Insights expects a 13% annual growth rate from 2026 to 2034 (Global Market Insights, Mar 2025).
- IMARC Group expects $5.7 billion by 2034, a 9.20% annual growth rate (IMARC Group, Oct 2026).
- Precedence Research expects $8.84 billion by 2035, an 11.56% annual growth rate (Precedence Research, Feb 2026).
- Straits Research expects $6.71 billion by 2034, an 8.06% annual growth rate (Straits Research, Sep 2026).
- Mordor Intelligence expects the CLM market to reach $6.26 billion by 2031, a 13.06% annual growth rate (Mordor Intelligence, Jan 2026).
- Grand View Research expects $7.3 billion by 2033, a 12.6% annual growth rate (Grand View Research, Oct 2026).
Which segments are growing fastest?
- Small and mid-sized companies are on track for a 15.1% annual growth rate in CLM through 2031 (Mordor Intelligence, Jan 2026).
- Large enterprises held 58.30% of CLM revenue in 2025 (Mordor Intelligence, Jan 2026).
- Multi-tenant SaaS held 60.25% of the CLM market in 2025 (Mordor Intelligence, Jan 2026).
- Cloud solutions held 76.85% of contract management software share in 2025 (Mordor Intelligence, Sep 2026).
- Straits Research expects the small and mid-sized segment to grow 15.2% a year through 2034 (Straits Research, Sep 2026).
- North America held 39.5% of the contract management software market in 2025 (Straits Research, Sep 2026).
- Healthcare and life sciences is expected to grow fastest by industry, at 14.3% a year (Straits Research, Sep 2026).
How Often Do Renewals and Obligations Get Missed?
Renewals and promised deliverables are where small lapses cost real money, and most teams still track them by hand. A renewal date in a spreadsheet is a guess about who will remember it.
How much does a missed renewal or obligation cost?
- Renewal costs from poor forward planning, such as auto-renewals on bad terms and missed notice periods, take 2 to 3% of contract value (WorldCC, Jan 2026).
- Penalties and disputes from missed obligations take another 1 to 2% (WorldCC, Jan 2026).
- Many contracts today contain several thousand obligations (WorldCC, Oct 2026).
- 49% of respondents say they spend too much time searching for completed agreements (Deloitte and Docusign, May 2024).
- 45% lack the tools to track, search and analyze past agreements (Deloitte and Docusign, May 2024).
How much lead time does a renewal need?
- Notice periods of 30, 60 and 90 days are most common in software contracts, though some are as short as one day or as long as 365 days or more (Zylo, Sep 2026).
- The average software renewal takes eight hours of preparation (Zylo, May 2026).
- Lines of business now own 81% of software spend, which makes renewal deadlines harder to track (Zylo, Sep 2026).
- The average company spends $55.8 million a year on software, up 8% from the year before (Zylo, Sep 2026).
If you buy from many vendors, put the renewal date and notice period in one place and check them every quarter. A written vendor contract that states the term, the notice period and the renewal price makes that check simple.
Do teams know what they have licensed?
- Complete visibility across the technology stack fell to 43% from 47% in a year (Flexera, Jun 2025).
- 45% of organizations spent over $1 million on software audits in the past three years (Flexera, Jun 2025).
- 23% of organizations spent more than $5 million on audits (Flexera, Jun 2025).
What Do Contract Analytics Statistics Show About Data Access?
You cannot analyze what you cannot find or read. The data shows an access and trust problem first, and a tooling problem second.
How many legal leaders prioritize contract analytics?
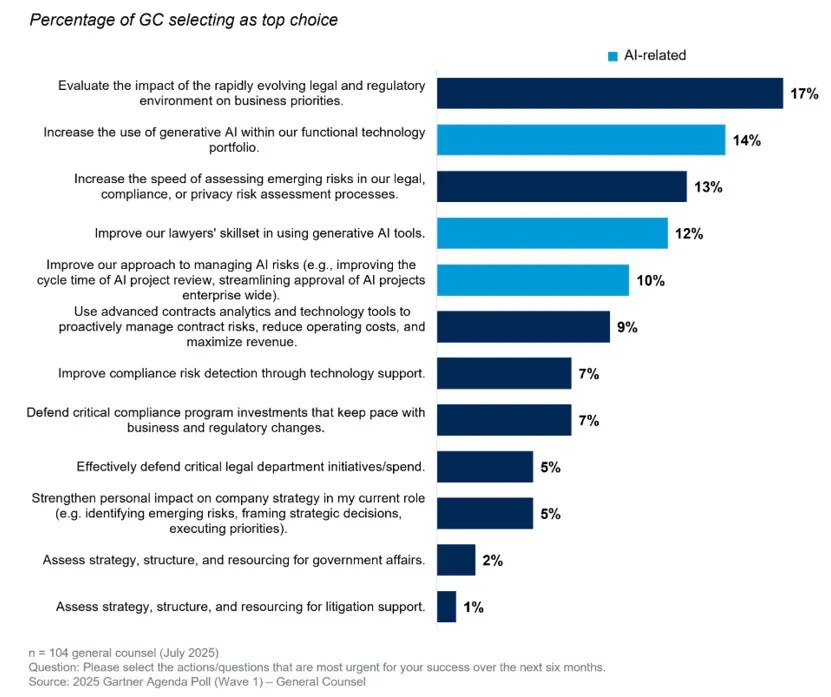
- 9% of general counsel chose advanced contract analytics as their most urgent priority for the next six months (Gartner, Oct 2025).
- The survey covered 104 general counsel in July 2025 (Gartner, Oct 2025).
- Gartner expects advanced contract analytics to reach the plateau of productivity in two to five years (Gartner, Nov 2024).
Can people read and use their own contracts?
- Almost 90% of business users find contracts difficult or impossible to understand (WorldCC, Aug 2025).
- 83% of executives say their contracts are too rigid to adapt to change (WorldCC, Aug 2025).
- Only 16% of practitioners believe negotiations focus on the right topics (WorldCC, Aug 2025).
- Over 50% of organizations have neither carried out nor plan any contract simplification effort (Deloitte, Sep 2023).
- 69% of big businesses say clear contracts matter when dealing with smaller firms, yet fewer than 20% have started to act on it (WorldCC, Oct 2024).
- 70% of organizations report a disconnect between contracts and financial oversight (WorldCC, Sep 2025).
- In about 70% of organizations, communication between legal and procurement is inconsistent and poorly executed (WorldCC, Jan 2026).
- Nearly 40% of legal operations leaders now judge their contract program on business metrics such as revenue and cost savings (Icertis, Mar 2025).
How Do Governments Manage Contracts at Scale?
Public buyers publish the cleanest contract data there is. It shows how much money moves through agreements, and how much a few points of oversight are worth.
How much does the federal government spend through contracts?
- Fiscal year 2025 obligations rose $17.8 billion from fiscal year 2024 after adjusting for inflation (GAO, Apr 2026).
- The overall competition rate was 66%, the same as in fiscal year 2024 (GAO, Apr 2026).
- Civilian agencies competed 89% of their contracts and defense agencies about 52% (GAO, Apr 2026).
- Agencies reported $18.2 billion in spending on other transaction agreements, which sit outside contract obligation data (GAO, Apr 2026).
- Small businesses won nearly 28% of prime federal contract dollars in fiscal year 2025, above the 23% goal (SBA, Jun 2026).
- That share equals $179 billion in prime contracts (SBA, Jun 2026).
- Counting subcontracts, small businesses received nearly $273 billion (SBA, Jun 2026).
How closely are those contracts overseen?
- GAO added DOD contract management to its High Risk List in 1992 and it is still there (GAO, Feb 2025).
- DOD’s fiscal year 2024 review of service requirements covered 197,000 contracts worth $163 billion in 40 meetings (GAO, Feb 2025).
- GAO’s High Risk List covers 38 areas that are vulnerable to waste, fraud, abuse and mismanagement (GAO, Feb 2025).
- FEMA obligated more than $10 billion on contracts from fiscal years 2018 through 2023 for disaster response and recovery (GAO, Feb 2025).
- About 83% of those obligations bought services, such as disaster planning support (GAO, Feb 2025).
- Twelve selected contracts accounted for 42% of obligations across three disasters (GAO, Feb 2025).
- VA put 91.7% of its $67.2 billion in fiscal year 2024 contract obligations on contracts managed under category management principles, above its 90% goal (GAO, Sep 2025).
- VA obligated more than $65 billion across the 10 common spending categories, about 13.3% of all such federal obligations (GAO, Sep 2025).
Methodology and Sources
Each figure comes from the organization that ran the survey, filed the document or published the forecast, and each link goes to the page we read. We checked that the number appears on that page with the date shown. Where a vendor paid for a study, such as a Forrester Total Economic Impact report, the vendor is named and the result is a modeled composite, not a market average. Market research pages carry no fixed release date, so their citations use the month the page was last updated. The numbers are not directly comparable across firms because each defines the market differently. Last updated October 2026. We review the page monthly and replace any figure that has a newer release. This page reports data and does not give legal advice. For related data, see freelance statistics and contract dispute statistics.
Glossary
- ACC: Association of Corporate Counsel, a professional body for in-house lawyers.
- CAGR: compound annual growth rate.
- CLM: contract lifecycle management, software that handles a contract from request to renewal.
- DOD: US Department of Defense.
- FEMA: Federal Emergency Management Agency.
- GAO: US Government Accountability Office.
- GSA: US General Services Administration.
- NDA: non-disclosure agreement.
- NPV: net present value, the value today of future benefits minus costs.
- OMB: US Office of Management and Budget.
- ROI: return on investment.
- SaaS: software as a service, software sold as a subscription.
- SBA: US Small Business Administration.
- TEI: Total Economic Impact, a Forrester method for modeling the return on a product.
- VA: US Department of Veterans Affairs.
- Value leakage: value an organization expected from a contract but did not receive after signing.
- WorldCC: World Commerce & Contracting, a not-for-profit research and membership group.
Sources
- ACC, Jun 2025
- Conga, Jun 2026
- Deloitte, Sep 2023
- Deloitte and Docusign, May 2024
- Docusign Form 10-K, Mar 2026
- Flexera, Jun 2025
- Forrester TEI for Docusign, Oct 2024
- Forrester TEI for Ironclad, May 2023
- Forrester TEI for LinkSquares, Oct 2025
- GAO, Apr 2026
- GAO, Feb 2025
- GAO, Sep 2025
- GAO, Feb 2025
- GAO, Feb 2025
- Gartner, Feb 2020
- Gartner, Nov 2024
- Gartner, Oct 2025
- Global Market Insights, Mar 2025
- Grand View Research, Oct 2026
- Icertis, Nov 2024
- Icertis, Mar 2025
- Icertis, Jun 2025
- IMARC Group, Oct 2026
- Ironclad, May 2026
- Ironclad, May 2026
- Ironclad, Sep 2026
- Ironclad, Feb 2025
- Ironclad, Mar 2025
- Mordor Intelligence, Jan 2026
- Mordor Intelligence, Sep 2026
- Precedence Research, Feb 2026
- SBA, Jun 2026
- Straits Research, Sep 2026
- Verified Market Research, Aug 2026
- WorldCC, Aug 2025
- WorldCC, Jan 2026
- WorldCC, Sep 2025
- WorldCC, Oct 2026
- WorldCC, Jun 2026
- WorldCC, Jan 2026
- WorldCC, Oct 2024
- Zylo, Sep 2026
- Zylo, May 2026
- Zylo, Sep 2026