Solopreneur statistics point one way: more people than ever file paperwork to start a business, and almost none plan to hire. Census recorded 5,671,836 new business applications in 2025 (U.S. Census Bureau, Oct 2026).
This page collects the numbers on businesses with no employees, called nonemployer firms. Most are one person working alone. The data comes from the Census Bureau, the Federal Reserve Banks, the Bureau of Labor Statistics, the Kauffman Foundation and two foreign statistics agencies.
Some figures are counts from tax records. Others come from surveys. The text says which is which, so you can tell a count of firms from an owner’s opinion. Every figure links to the agency that published it.
Key Takeaways
- Nonemployer establishments grew 18.0% between 2019 and 2024, a gain of 4,881,868 (U.S. Census Bureau, Sep 2026).
- 60.4% of nonemployer establishments took in less than $25,000 in 2024, by our calculation (U.S. Census Bureau, Sep 2026).
- Only 126,356 nonemployer establishments, 0.4% of the total, reached $1 million in receipts in 2024 (U.S. Census Bureau, Sep 2026).
- 8.8% of 2025 business applications listed planned wages, down from 13.7% in 2019, by our calculation (U.S. Census Bureau, Oct 2026).
- Applications from January to September 2026 reached 4,927,840, up 15.3% on the same months of 2025 (U.S. Census Bureau, Oct 2026).
- 83.3% of new US entrepreneurs started a business out of opportunity rather than necessity in 2025 (Kauffman Foundation, May 2026).
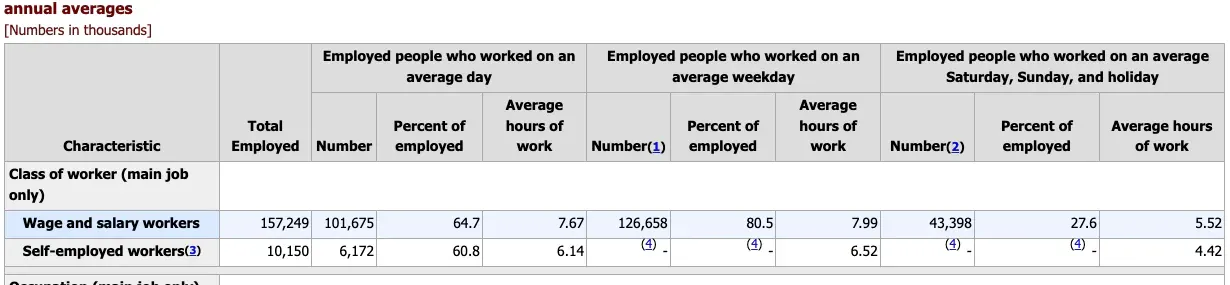
- Self-employed workers averaged 6.14 hours of work on days they worked in 2025, against 7.67 hours for wage and salary workers (U.S. Bureau of Labor Statistics, Jun 2026).
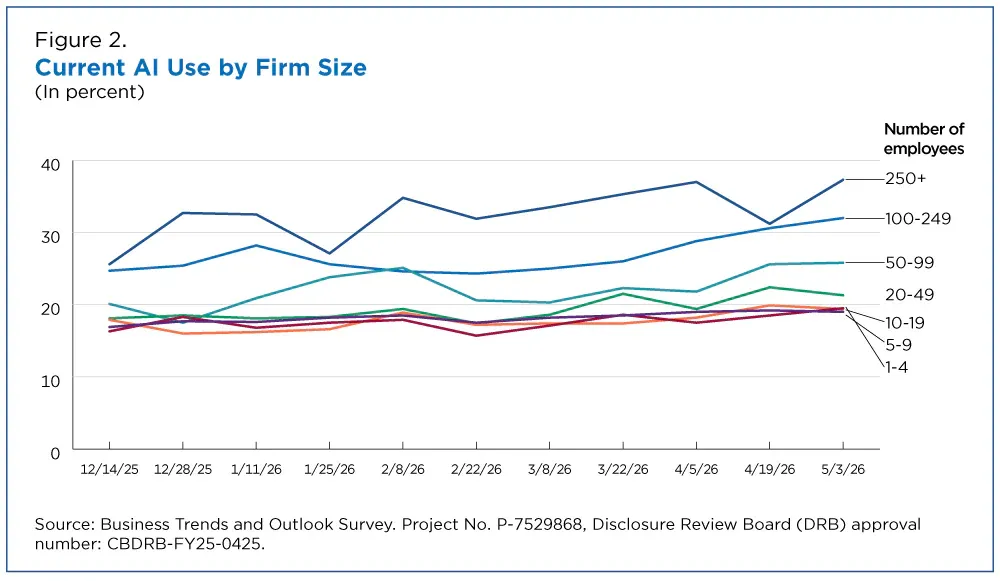
- Less than 20% of firms with four or fewer employees reported using AI in the period ending May 3, 2026 (U.S. Census Bureau, May 2026).
- 40% of nonemployer firms used AI in the fall 2025 Federal Reserve survey, against 46% of employer firms (Federal Reserve Banks, Jul 2026).
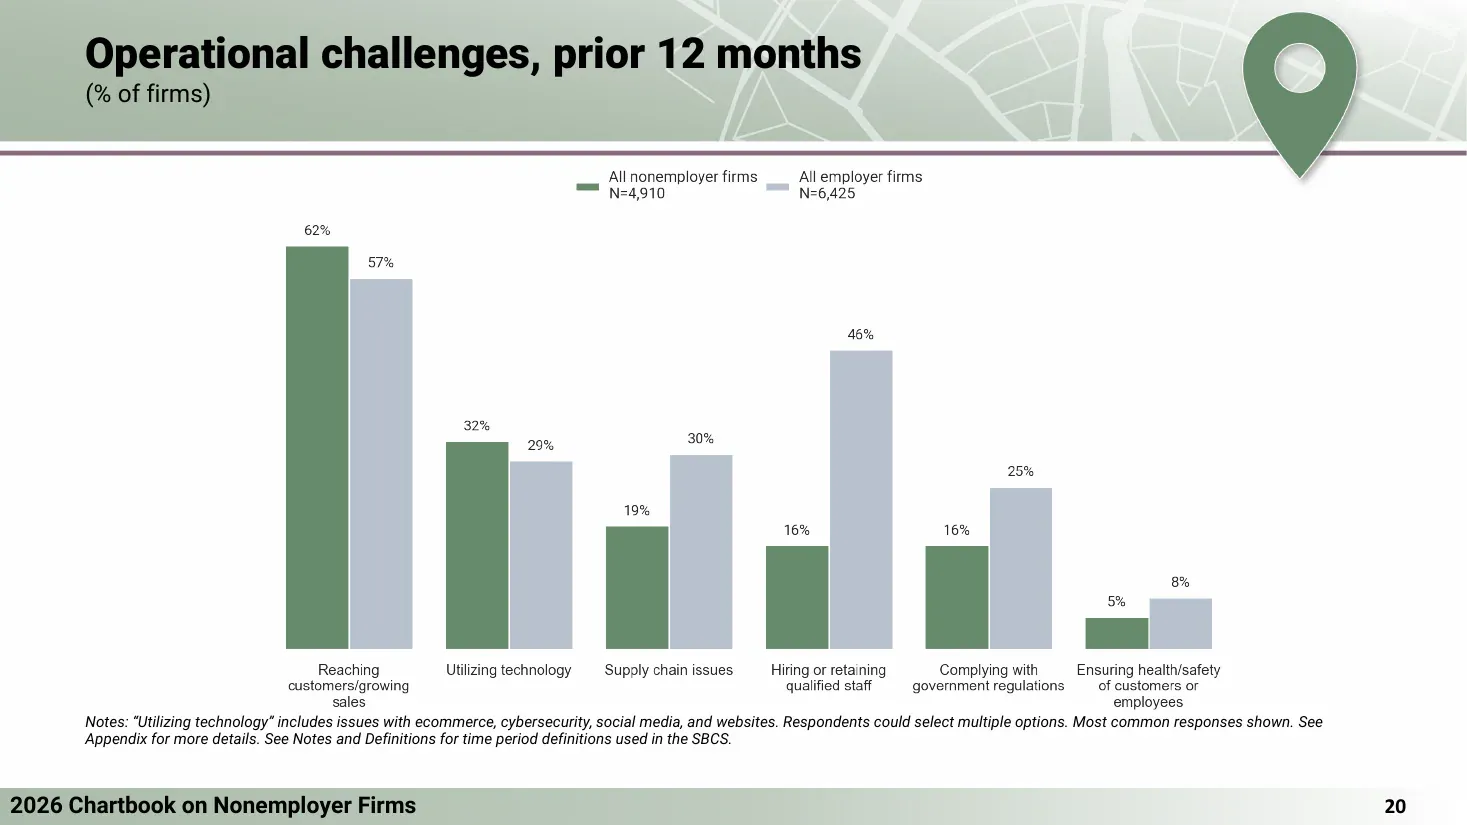
- 62% of nonemployer firms named reaching customers or growing sales as an operational challenge (Federal Reserve Banks, Jul 2026).
- 79.9% of barbers were self-employed in 2025 (U.S. Bureau of Labor Statistics, Aug 2026).
- The UK had 4,272,535 private sector businesses with no employees at the start of 2025, 75% of all businesses (UK Department for Business and Trade, Oct 2025).
- Australia’s non-employing businesses grew 4.8% in 2025-26 while employing businesses grew 0.2% (Australian Bureau of Statistics, Aug 2026).
How many one-person businesses are there in the US?
The count keeps rising, and it rises faster than the count of firms with staff. The numbers below show how big the base is, how fast it grew and what legal shape it takes.
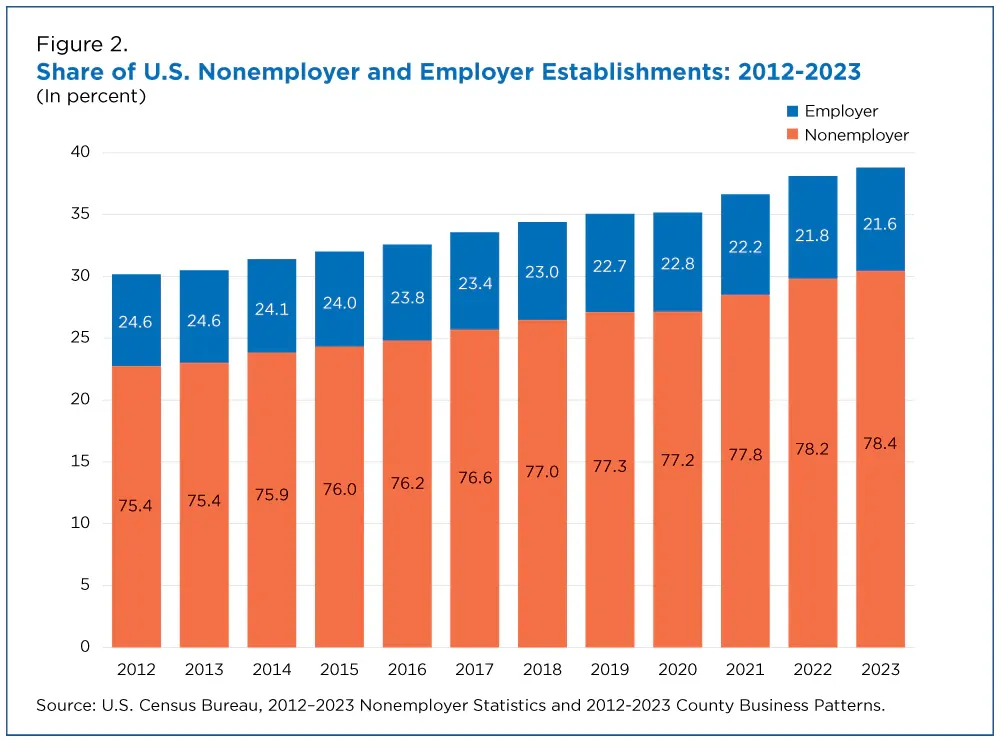
How fast is the nonemployer count growing?
- The 2019 count stood at 27,104,006 nonemployer establishments (U.S. Census Bureau, Jun 2022).
- The count rose by 1,558,066, or 5.1%, from 2023 to 2024, by our calculation (U.S. Census Bureau, Sep 2026).
- Receipts of nonemployer establishments grew 38.8% from 2019 to 2024, by our calculation (U.S. Census Bureau, Sep 2026).
- Receipts grew 6.2% from 2023 to 2024, faster than the count of establishments grew, by our calculation (U.S. Census Bureau, Sep 2026).
- The number of nonemployer establishments rose every year from 1997 to 2023 except 2008 (U.S. Census Bureau, Jul 2025).
- 15 of 18 industry sectors added nonemployer establishments in 2023 (U.S. Census Bureau, Jul 2025).
Which states gained or lost solo businesses?
- Delaware, Florida and Wyoming had the largest percentage gains from 2022 to 2023, at 5.1%, 5.0% and 4.8% (U.S. Census Bureau, Jul 2025).
- Louisiana lost 11,708 nonemployers, a 2.7% drop, and was the only state to lose both nonemployers and people (U.S. Census Bureau, Jul 2025).
What legal form do solo firms take?
- Partnerships made up 2,367,086 nonemployer establishments, or 7.4%, in 2024 (U.S. Census Bureau, Sep 2026).
- S corporations numbered 1,489,244, or 4.7%, and C corporations numbered 485,357, or 1.5% (U.S. Census Bureau, Sep 2026).
- Sole proprietorships took 60.4% of nonemployer receipts, partnerships 21.4% and S corporations 13.6%, by our calculation (U.S. Census Bureau, Sep 2026).
- Census describes most nonemployers as self-employed people running unincorporated businesses that may or may not be their main income (U.S. Census Bureau, Sep 2026).
- The BLS counted 6,897,000 incorporated self-employed workers in September 2026 on an unadjusted basis (U.S. Bureau of Labor Statistics, Sep 2026).
- A year earlier the count was 7,164,000 (U.S. Bureau of Labor Statistics, Sep 2026).
How much do one-person businesses sell, and to whom?
Most solo firms are small, and a few are not. Tax records show where the weight sits. A Federal Reserve survey adds who the customers are.
How are receipts spread across size classes?
- 22.4% of nonemployer establishments, or 7,176,486, had receipts under $5,000 in 2024 (U.S. Census Bureau, Sep 2026).
- 37.3% had receipts under $10,000, by our calculation (U.S. Census Bureau, Sep 2026).
- 75.4% had receipts under $50,000, by our calculation (U.S. Census Bureau, Sep 2026).
- 4,257,187 establishments, or 13.3% by our calculation, had receipts of $100,000 or more (U.S. Census Bureau, Sep 2026).
- 1,051 establishments reported receipts above $5 million (U.S. Census Bureau, Sep 2026).
- In the Federal Reserve survey, 17% of nonemployer firms reported revenue between $100,000 and $250,000 (Federal Reserve Banks, Jul 2026).
- Only 8% of employer firms reported revenue of $25,000 or less (Federal Reserve Banks, Jul 2026).
Who buys from solo firms?
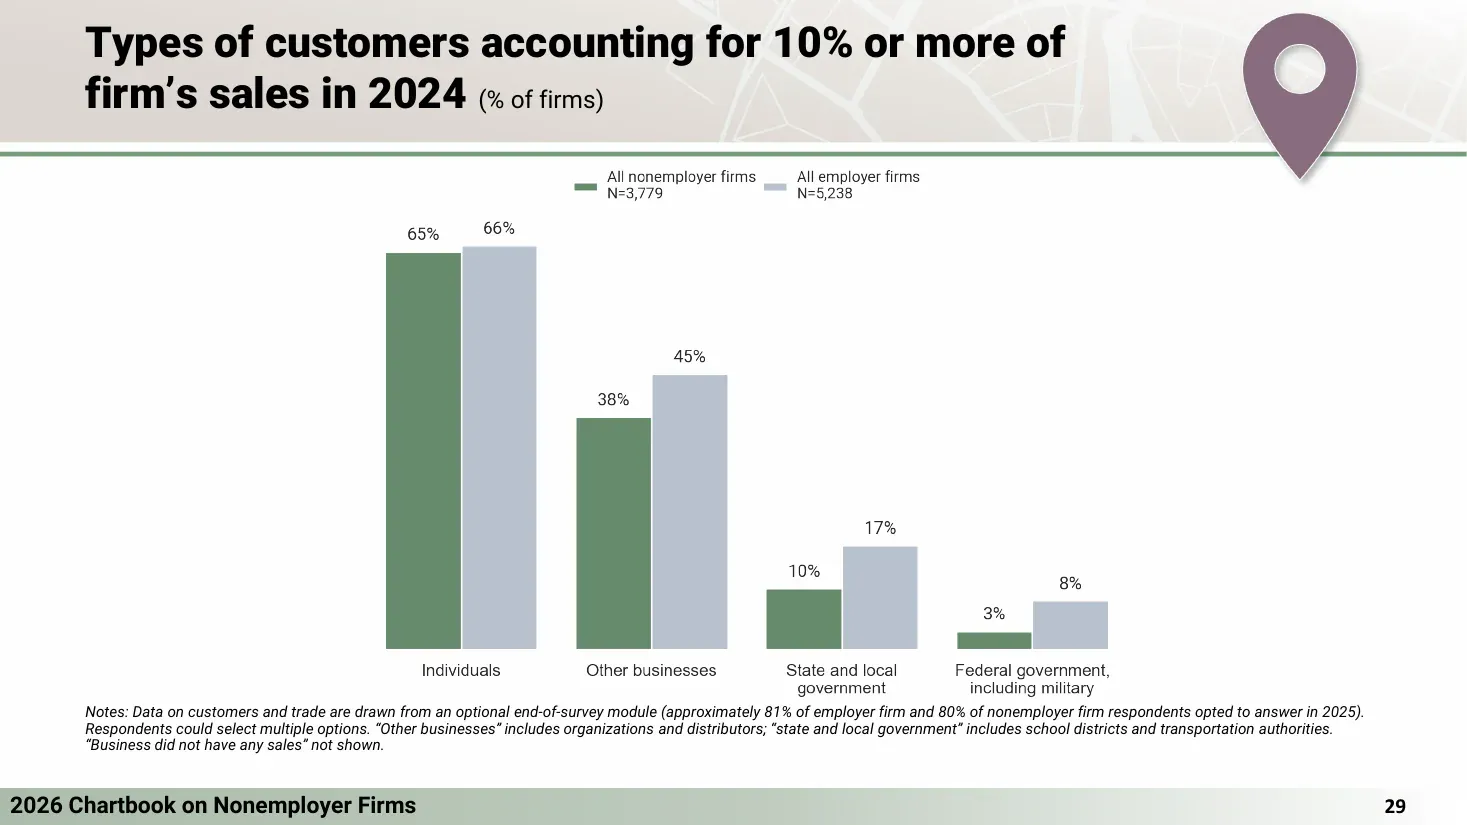
Individuals are the main buyers, but a large minority sell to other businesses. That is where a written scope, price and payment date start to matter, as in a client contract.
- 65% of nonemployer firms had individual customers that made up 10% or more of 2024 sales (Federal Reserve Banks, Jul 2026).
- 38% had business or organization customers at that level (Federal Reserve Banks, Jul 2026).
- 10% sold to state and local government at that level, and 3% to the federal government (Federal Reserve Banks, Jul 2026).
- 82% reported no sales to customers outside the US (Federal Reserve Banks, Jul 2026).
Which industries do one-person businesses work in?
Solo work spans trades, services and property. The largest groups are not the ones most people picture. The counts below are 2024 establishments with no paid staff.
Which sectors have the most solo establishments?
- Other services, which covers repair, personal care and similar work, had 3,352,476 (U.S. Census Bureau, Sep 2026).
- Real estate and rental and leasing had 3,263,571 (U.S. Census Bureau, Sep 2026).
- Administrative and support services had 3,082,024 (U.S. Census Bureau, Sep 2026).
- Construction had 3,042,704 (U.S. Census Bureau, Sep 2026).
- Health care and social assistance had 2,395,760 (U.S. Census Bureau, Sep 2026).
- Retail trade had 2,178,016, and arts, entertainment and recreation had 1,806,368 (U.S. Census Bureau, Sep 2026).
- Real estate and rental and leasing took in the most receipts of any sector, at $363.4 billion (U.S. Census Bureau, Sep 2026).
Which narrow trades are the biggest?
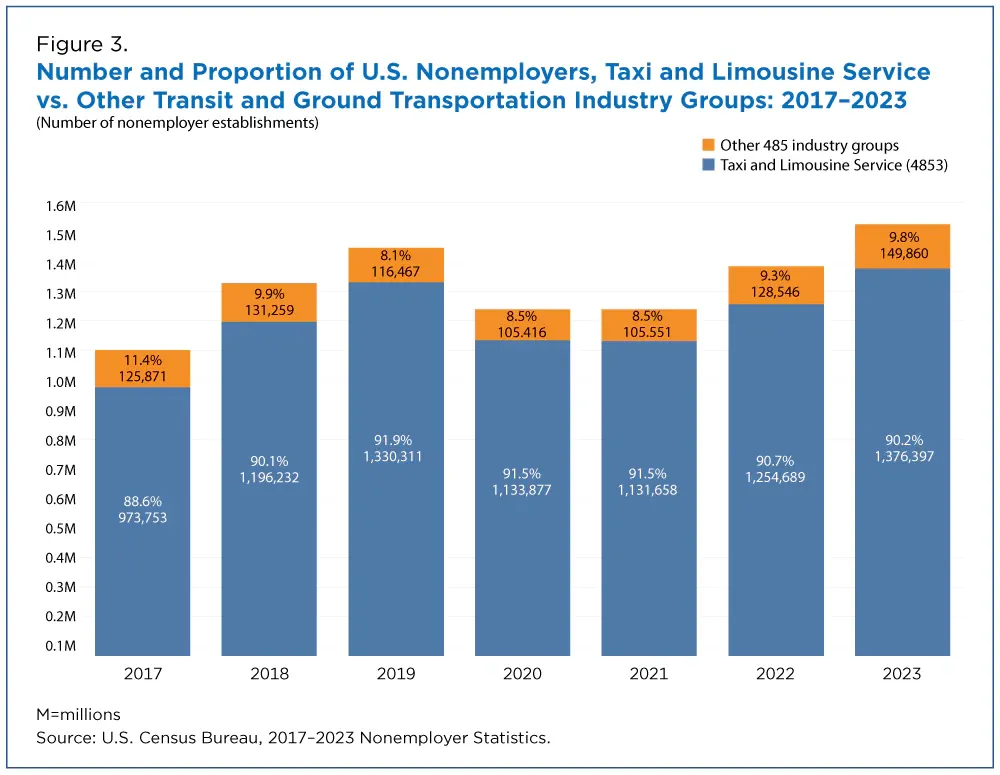
- Taxi and limousine service had 1,602,297 nonemployer establishments in 2024 (U.S. Census Bureau, Sep 2026).
- Lessors of real estate had 1,380,438 (U.S. Census Bureau, Sep 2026).
- Janitorial and building services had 1,173,265, and landscaping services had 537,970 (U.S. Census Bureau, Sep 2026).
- Management and technical consulting had 1,187,781 (U.S. Census Bureau, Sep 2026).
- Independent artists, writers and performers had 1,115,783 (U.S. Census Bureau, Sep 2026).
- Health and personal care retailers lost 46,558 nonemployers, a 13.5% drop, from 2022 to 2023 (U.S. Census Bureau, Jul 2025).
Which jobs are most often done as self-employment?
The share of workers who are self-employed varies from under 10% to nearly 80%, depending on the trade.
- 54.3% of real estate sales agents were self-employed in 2025 (U.S. Bureau of Labor Statistics, Aug 2026).
- 35.6% of massage therapists were self-employed (U.S. Bureau of Labor Statistics, Aug 2026).
- 31.3% of construction and maintenance painters were self-employed (U.S. Bureau of Labor Statistics, Aug 2026).
- 27.6% of interpreters and translators were self-employed (U.S. Bureau of Labor Statistics, Aug 2026).
- 25.1% of carpenters were self-employed (U.S. Bureau of Labor Statistics, Aug 2026).
- 12.3% of tutors and 7.1% of electricians were self-employed (U.S. Bureau of Labor Statistics, Aug 2026).
Where are new applications coming from?
- Retail trade filed the most business applications in 2025, at 1,166,015 or 20.6% of the total (U.S. Census Bureau, Oct 2026).
- Professional, scientific and technical services filed 764,007, or 13.5% (U.S. Census Bureau, Oct 2026).
- Construction filed 519,090, or 9.2% (U.S. Census Bureau, Oct 2026).
How many people start a one-person business each year?
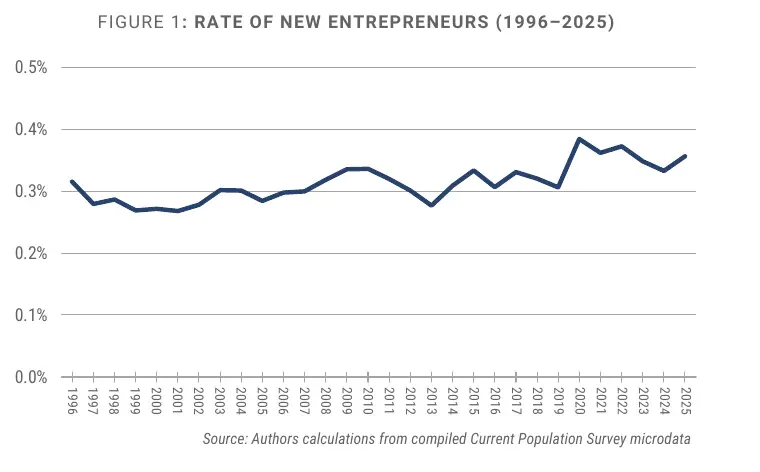
Starts are at record levels, and the share that plan to hire has fallen. The tax ID data and a long-running entrepreneurship index tell the same story from two sides.
How many business applications are filed?
- Applications for a tax ID totaled 3,498,990 in 2019 (U.S. Census Bureau, Oct 2026).
- They reached 5,390,816 in 2021 and 5,469,302 in 2023 (U.S. Census Bureau, Oct 2026).
- The 2024 total was 5,224,176, which means 2025 beat it by 8.6%, by our calculation (U.S. Census Bureau, Oct 2026).
- 1,708,842 applications in 2025 were rated high-propensity, meaning likely to turn into employers, or 30.1% of the total by our calculation (U.S. Census Bureau, Oct 2026).
- Applications with planned wages fell to 336,905 in January to September 2026, from 397,614 in the same months of 2025 (U.S. Census Bureau, Oct 2026).
- Seasonally adjusted applications in September 2026 were 534,947, and 35,786 of them listed planned wages (U.S. Census Bureau, Oct 2026).
- Census projected 29,022 of the September 2026 applicants would form employer businesses within four quarters (U.S. Census Bureau, Oct 2026).
Why do people start on their own?
Most start because they see a chance, not because they have to. That share dipped in 2020 and has only partly recovered.
- On average 360 of every 100,000 US adults became a new entrepreneur each month in 2025 (Kauffman Foundation, May 2026).
- The opportunity share fell to 69.8% in 2020, from 86.9% in 2019 (Kauffman Foundation, May 2026).
- That 17.1 point drop was far larger than the 6.9 point drop from 2008 to 2009 (Kauffman Foundation, May 2026).
- The monthly rate was 0.44% for men and 0.28% for women in 2025 (Kauffman Foundation, May 2026).
- Immigrants started businesses at 0.60% a month, twice the 0.30% rate for native-born adults (Kauffman Foundation, May 2026).
- The rate was 0.53% for Latino adults, 0.45% for Black adults, 0.33% for Asian adults and 0.29% for white adults (Kauffman Foundation, May 2026).
- The 20 to 34 age group had the lowest rate, at 0.26% (Kauffman Foundation, May 2026).
Who owns one-person businesses?
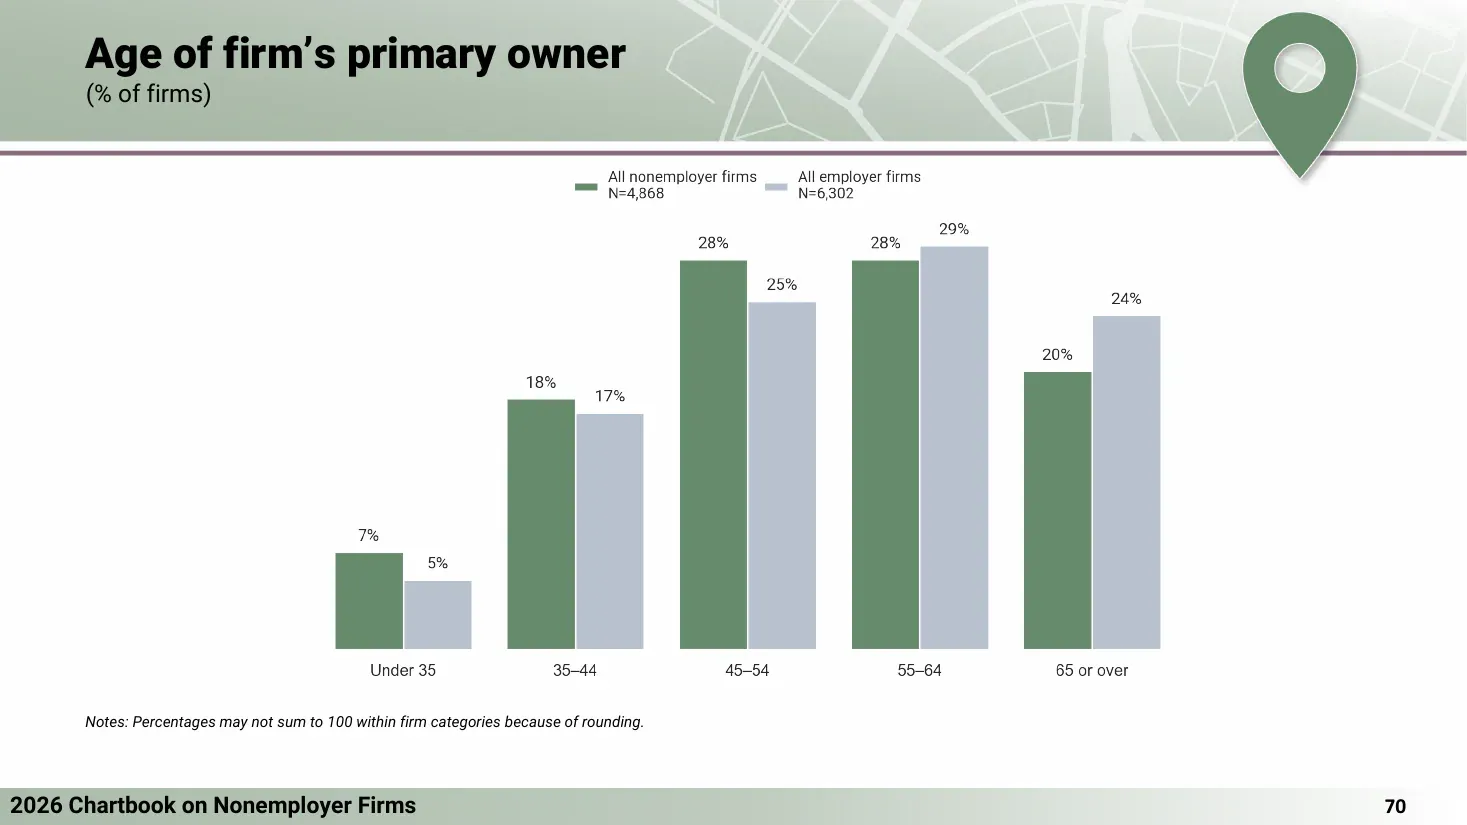
Solo owners skew older than the startup stereotype. More than half of the firms in the Federal Reserve sample belong to someone aged 45 to 64.
How old are the owners?
- 28% of nonemployer firms had a primary owner aged 45 to 54 (Federal Reserve Banks, Jul 2026).
- Another 28% had an owner aged 55 to 64, and 20% had an owner aged 65 or older (Federal Reserve Banks, Jul 2026).
- 18% of owners were aged 35 to 44, and 7% were under 35 (Federal Reserve Banks, Jul 2026).
How many owners does a solo firm have?
- 75% of nonemployer firms had a single owner (Federal Reserve Banks, Jul 2026).
- 21% had two owners, and 2% had three (Federal Reserve Banks, Jul 2026).
Which owner groups are most common?
- 22% of nonemployer firms were majority-owned by immigrants (Federal Reserve Banks, Jul 2026).
- 11% were majority-owned by someone with a disability, and 9% by veterans (Federal Reserve Banks, Jul 2026).
- 6% were majority-owned by LGBTQ owners, and 11% were in rural areas (Federal Reserve Banks, Jul 2026).
How many hours do one-person business owners work?
Self-employed people work fewer hours on a typical day than employees do. The survey counts time at the main job only, so unpaid work outside it is not in these figures.
How long is the working day?
- 6,172,000 of 10,150,000 employed self-employed people worked on an average day in 2025 (U.S. Bureau of Labor Statistics, Jun 2026).
- That is 60.8% of the group, against 64.7% of wage and salary workers (U.S. Bureau of Labor Statistics, Jun 2026).
- On an average weekday, those who worked put in 6.52 hours, against 7.99 for wage and salary workers (U.S. Bureau of Labor Statistics, Jun 2026).
- On weekends and holidays the figure was 4.42 hours, against 5.52 hours (U.S. Bureau of Labor Statistics, Jun 2026).
- The survey counts only owners of unincorporated businesses as self-employed and covers main job work, without travel (U.S. Bureau of Labor Statistics, Jun 2026).
Do one-person businesses use AI?
Adoption looks low or middling depending on who asks. Census finds low use among the smallest firms. The Federal Reserve finds higher use among nonemployers that chose to answer an optional module, so treat the two as bookends.
How many businesses use AI?
- National AI use stood at 19.8% in the period ending May 3, 2026 (U.S. Census Bureau, May 2026).
- Use hovered between 17% and 20% from December 2025 to May 2026 (U.S. Census Bureau, May 2026).
- Use did not change significantly among firms with fewer than 20 employees over that period (U.S. Census Bureau, May 2026).
- 37% of firms with 250 or more employees used AI, and 32% of firms with 100 to 249 employees did (U.S. Census Bureau, May 2026).
- 18% of nonemployer firms planned to start using AI within 12 months, and 36% had no plans (Federal Reserve Banks, Jul 2026).
- Among nonemployer users, 45% were experimenting and 10% had fully integrated AI (Federal Reserve Banks, Jul 2026).
What do solo owners use AI for?
Writing and marketing lead by a wide margin. Coding and automation sit far behind.
- 87% of nonemployer AI users used it for writing or marketing (Federal Reserve Banks, Jul 2026).
- 63% used it for individual productivity, and 61% for planning or analysis (Federal Reserve Banks, Jul 2026).
- 36% used it for administrative functions, and 29% for customer service (Federal Reserve Banks, Jul 2026).
- 20% used it for coding, and 19% for process automation (Federal Reserve Banks, Jul 2026).
What results and problems do owners report?
- 79% of nonemployer AI users said productivity increased (Federal Reserve Banks, Jul 2026).
- 52% said quality of goods or services increased, and 33% said sales increased (Federal Reserve Banks, Jul 2026).
- 51% named accuracy, such as bias or misinformation, as a challenge (Federal Reserve Banks, Jul 2026).
- 39% named adapting tools to business needs, and 24% named cost (Federal Reserve Banks, Jul 2026).
- Among firms with no plans to use AI, 52% said it did not apply to their business and 35% said they preferred not to (Federal Reserve Banks, Jul 2026).
What problems do one-person business owners report?
Finding customers outranks money trouble for solo owners, and they cite hiring and rules far less than employer firms do. Money problems come mostly from costs, credit and cash.
What operational problems come up?
- 32% of nonemployer firms named using technology as a challenge, against 29% of employer firms (Federal Reserve Banks, Jul 2026).
- 19% named supply chain issues, against 30% of employer firms (Federal Reserve Banks, Jul 2026).
- 16% named hiring or retaining staff, against 46% of employer firms (Federal Reserve Banks, Jul 2026).
- 16% named complying with government regulations, against 25% of employer firms (Federal Reserve Banks, Jul 2026).
How do owners respond to money trouble?
- 38% of nonemployer firms that hit financial challenges reduced costs, and 38% used cash reserves (Federal Reserve Banks, Jul 2026).
- 31% raised prices, and 26% took on debt (Federal Reserve Banks, Jul 2026).
- 23% downsized operations (Federal Reserve Banks, Jul 2026).
- 29% reported higher costs tied to tariffs, against 42% of employer firms (Federal Reserve Banks, Jul 2026).
How do solo firms fund themselves?
- 52% of nonemployer firms regularly used a credit card, 23% a loan and 16% a line of credit (Federal Reserve Banks, Jul 2026).
- 31% did not regularly use external financing, and 51% had no debt (Federal Reserve Banks, Jul 2026).
- 26% of nonapplicants said they avoided debt, and 17% felt discouraged from applying (Federal Reserve Banks, Jul 2026).
- 62% used the owner’s personal credit score for their business (Federal Reserve Banks, Jul 2026).
- Low credit score was the top reason for credit denial, at 44% (Federal Reserve Banks, Jul 2026).
Do one-person businesses grow, hire or close?
Most stay solo, and many are young. The few that plan to hire face a tougher credit market than the ones that stay as they are.
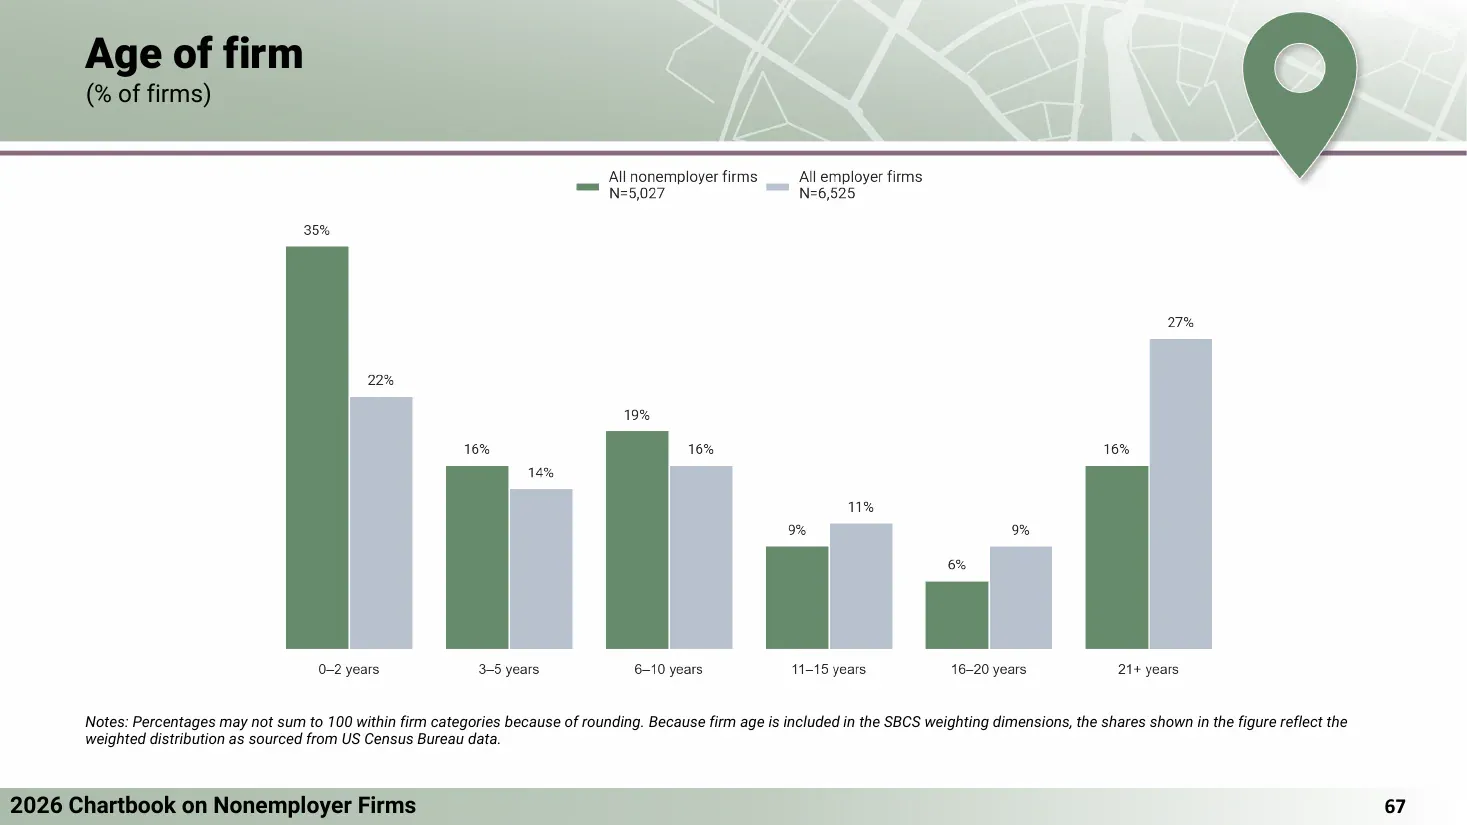
How old are solo firms?
- 35% of nonemployer firms were 0 to 2 years old, against 22% of employer firms (Federal Reserve Banks, Jul 2026).
- 19% were 6 to 10 years old (Federal Reserve Banks, Jul 2026).
- 16% were 21 years old or more, against 27% of employer firms (Federal Reserve Banks, Jul 2026).
What happens when a solo owner wants to hire?
Hiring brings new paperwork: offer letters, contractor terms and work for hire rules. A written agreement, such as a simple service agreement, is the first step for many owners.
- 58% of early-stage nonemployers that planned to hire had applied for new financing (Federal Reserve Banks, Oct 2025).
- Among those that applied for loans, lines of credit or cash advances, 50% of early-stage hiring planners were denied (Federal Reserve Banks, Oct 2025).
- The denial rate was 42% for later-stage hiring planners and 34% for nonemployers with no hiring plans (Federal Reserve Banks, Oct 2025).
How many new businesses survive the first year?
Survival data covers employer establishments, because no US agency publishes a matching series for nonemployers. It still sets a reference point.
- 77.9% of new businesses survived their first year in 2025 on the Kauffman startup early survival measure (Kauffman Foundation, May 2026).
- New employer startups created 5.3 jobs per 1,000 people in 2025 (Kauffman Foundation, May 2026).
- One-year survival was lowest for establishments born in 2001 and 2008, both recession years (U.S. Bureau of Labor Statistics, Mar 2024).
- The best regional one-year rate was 84.6% in the Pacific division for 2021 births, and the worst was 71.4% in the South Atlantic for 2008 births (U.S. Bureau of Labor Statistics, Mar 2024).
How do the UK and Australia compare?
Both countries count solo firms as a large majority of all businesses, and both saw them grow in the latest year. The UK figures come from a department that models unregistered businesses, which makes them estimates.
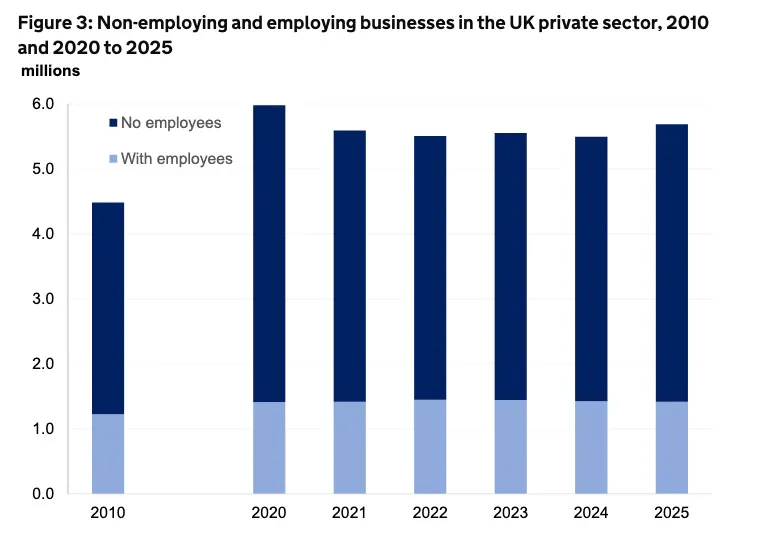
How big is the UK solo base?
- The UK had 5,690,265 private sector businesses at the start of 2025 (UK Department for Business and Trade, Oct 2025).
- Businesses with no employees had turnover of £402.6 billion (UK Department for Business and Trade, Oct 2025).
- They employed 4.664 million people, owners included (UK Department for Business and Trade, Oct 2025).
- 3.2 million sole proprietorships made up 57% of UK private sector businesses (UK Department for Business and Trade, Oct 2025).
- 3.0 million sole proprietorships and 948,000 companies had no employees besides the owners (UK Department for Business and Trade, Oct 2025).
- 12% of sole proprietorships were registered for VAT or PAYE (UK Department for Business and Trade, Oct 2025).
How fast is the UK solo base growing?
- Non-employing businesses rose by 1.014 million, or 31%, from 2010 to 2025 (UK Department for Business and Trade, Oct 2025).
- They accounted for 84% of all business growth over that period (UK Department for Business and Trade, Oct 2025).
- Their number fell by 295,000, or 6.5%, from 2020 to 2025 (UK Department for Business and Trade, Oct 2025).
- It rose by 201,000, or 4.9%, from 2024 to 2025 (UK Department for Business and Trade, Oct 2025).
- Unregistered businesses made up 174,000 of that rise and registered businesses made up 27,000 (UK Department for Business and Trade, Oct 2025).
- Sole proprietorships rose by 462,000, or 17%, from 2010 to 2025 (UK Department for Business and Trade, Oct 2025).
How many businesses open and close in Australia?
- Australia had 2,814,778 actively trading businesses at 30 June 2026, and 996,203 of them had employees (Australian Bureau of Statistics, Aug 2026).
- The count of non-employing businesses rose by 83,105 in 2025-26 (Australian Bureau of Statistics, Aug 2026).
- Net movement of 28,127 surviving businesses went from employing to non-employing (Australian Bureau of Statistics, Aug 2026).
- Employing businesses rose by only 2,025, the first net rise since 2021-22 (Australian Bureau of Statistics, Aug 2026).
- The entry rate was 16.9%, with 460,461 entries, and the exit rate was 13.8%, with 375,331 exits (Australian Bureau of Statistics, Aug 2026).
- The net increase in businesses was 3.1%, or 85,130 (Australian Bureau of Statistics, Aug 2026).
Methodology and Sources
Every figure comes from the agency or foundation that produced it, and each link was opened and checked in October 2026. Where we divided or summed published counts, the text says “by our calculation.” Census size classes follow the Nonemployer Statistics record layout. Annual business application totals add the unadjusted monthly series, so they can differ from seasonally adjusted headlines. Federal Reserve results come from a convenience sample and are not a random draw, so read them as owner reports, not as counts. This page is refreshed monthly.
Glossary
- Nonemployer firm: a business with no paid employees besides its owners, subject to federal income tax.
- NES: Census Bureau Nonemployer Statistics, built from tax records.
- BFS: Census Bureau Business Formation Statistics, built from EIN applications.
- BTOS: Census Bureau Business Trends and Outlook Survey.
- SBCS: Federal Reserve Small Business Credit Survey.
- EIN: employer identification number, the tax ID a business applies for.
- High-propensity application: an application the Census Bureau rates as likely to become an employer business.
- Opportunity share: the percent of new entrepreneurs who started a business by choice, not necessity.
- PAYE and VAT: UK payroll tax and sales tax systems.
Sources
- Nonemployer Statistics 2024, national file (nonemp24us)
- Nonemployer Statistics 2019, national file (nonemp19us)
- Census Bureau Releases 2024 Nonemployer Statistics
- Number of U.S. Nonemployers Grew Faster Than Employer Businesses Nearly Every Year From 2012 to 2023
- Business Formation Statistics
- Business Formation Statistics, September 2026 release
- Large Firms With at Least 20 Employees Biggest AI Users (BTOS)
- 2026 Chartbook on Nonemployer Firms, 2025 Small Business Credit Survey
- 2025 Report on Nonemployer Firms: Findings on Hiring Plans
- Employment Situation, Table A-9: Selected employment indicators
- American Time Use Survey 2025, Table 5
- Employment Projections, occupational projections and worker characteristics, 2025-35
- The Economics Daily: 1-year survival rates for new business establishments
- National Report on Early-Stage Entrepreneurship in the United States: 2025
- Business Population Estimates for the UK and Regions 2025
- Counts of Australian Businesses, including Entries and Exits