Web design statistics for 2026 point one way: the work is steady, the pay is high, and most sites still miss the basics of speed and access. The numbers below come from the agencies, researchers and survey teams that produced them, not from roundups.
They cover the trade as a business: how many people do the work, what they earn, what a project costs, and who builds small business sites. They also cover what clients and visitors ask for, how fast sites load, and where accessibility stands. Graphic design, marketing agency data and general freelancer data live on other pages.
Every figure carries its publisher, a link to the primary document and the date of the data. Where two sources measure the same thing differently, the page says so.
Key Takeaways
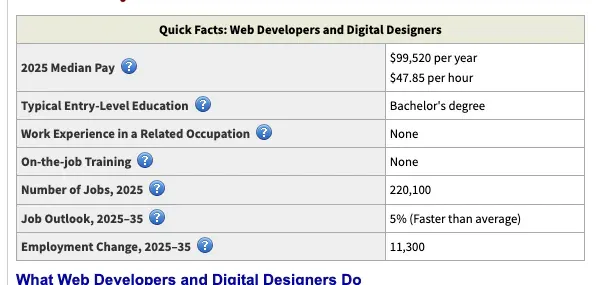
- Web developers and digital designers held 220,100 US jobs in 2025, and BLS projects 5% growth through 2035 (BLS, Aug 2026).
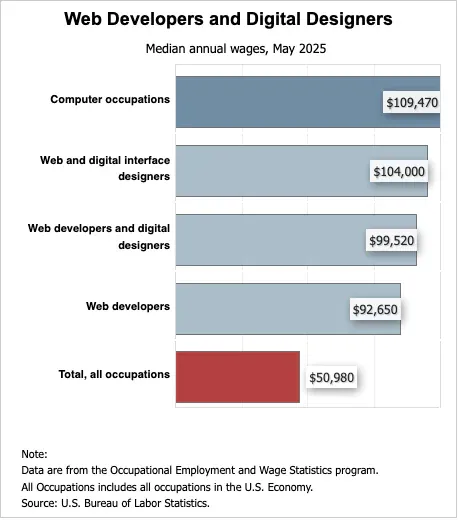
- Web and digital interface designers earned a median $104,000 in May 2025, about twice the $50,980 median for all occupations (BLS, Aug 2026).
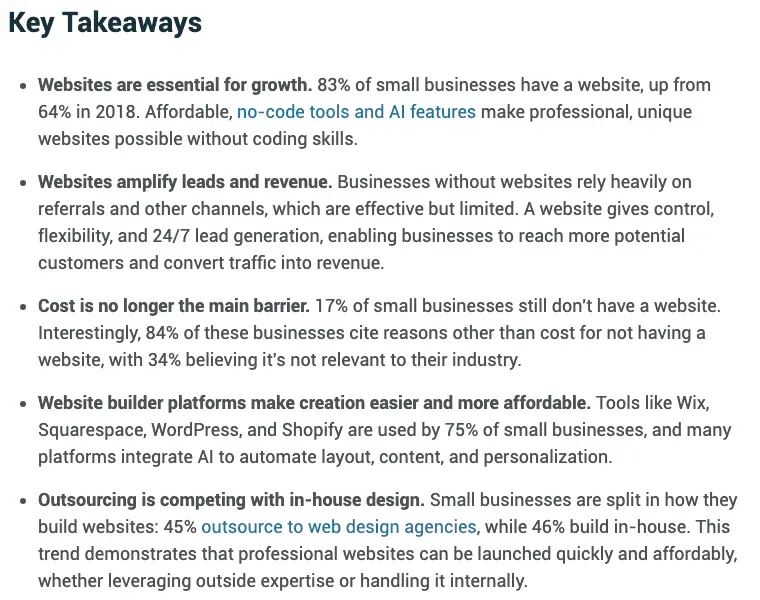
- 83% of US small businesses have a website, up from 64% in 2018 (Clutch, Aug 2025).
- Agencies built 45% of small business websites, while freelancers and consultants built 9% (Clutch, Aug 2025).
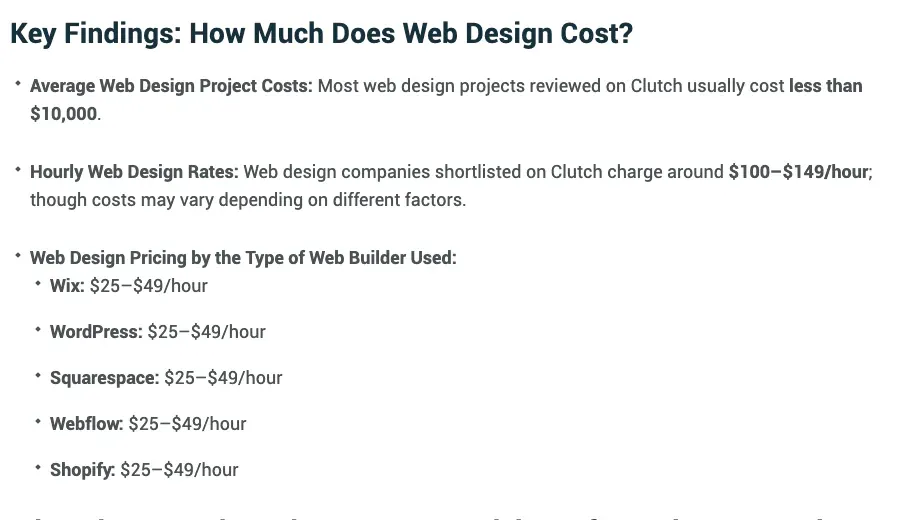
- Most web design projects reviewed on Clutch cost less than $10,000, and shortlisted agencies charge $100 to $149 an hour (Clutch, Sep 2026).
- Only 28% of surveyed enterprise organizations always deliver web projects on time and within budget (Webflow, Jul 2025).
- A peer-reviewed study set the window for a good first impression of a website at 50 milliseconds (Behaviour and Information Technology, Mar 2006).
- Mobile devices held 58.99% of worldwide web usage in September 2026, as StatCounter measures it (StatCounter, Sep 2026).
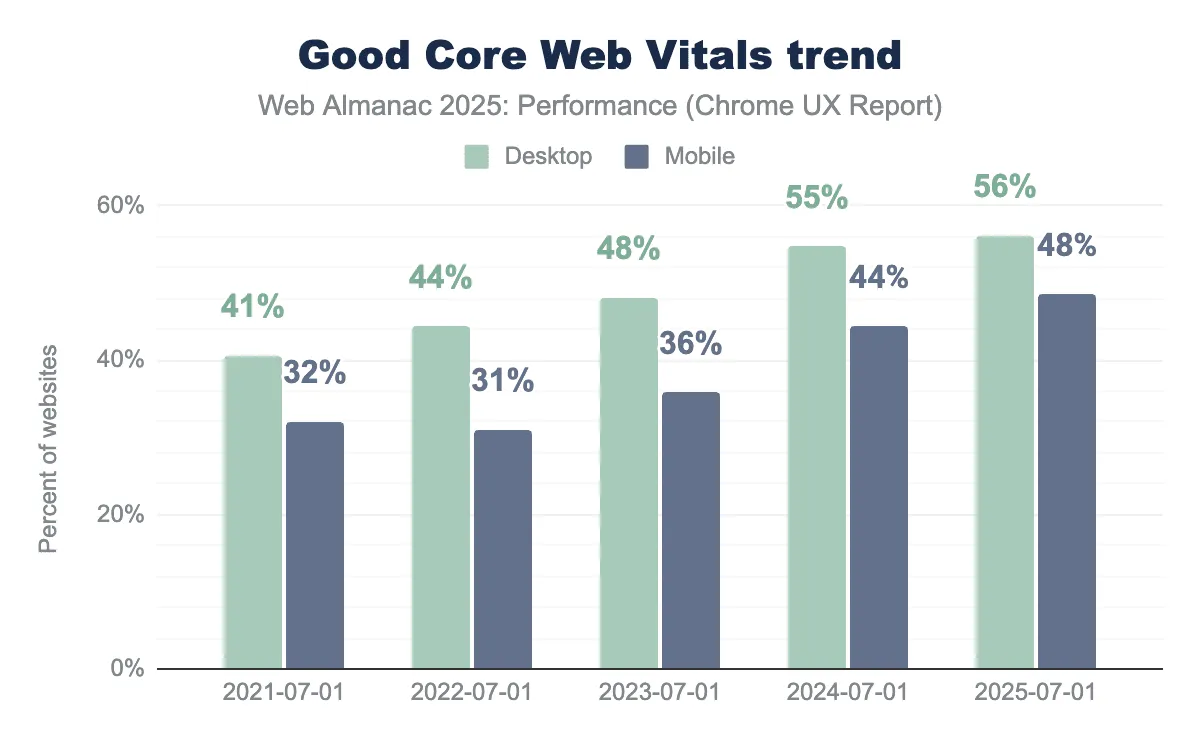
- Only 48% of mobile websites had good Core Web Vitals in 2025 (HTTP Archive, Jan 2026).
- A 0.1 second faster mobile site lifted retail conversions by 8.4% (Deloitte, Mar 2020).
- 53% of mobile visitors leave a page that takes longer than three seconds to load (Think with Google, Mar 2017).
- 95.9% of the top one million home pages had detected WCAG 2 failures (WebAIM, Feb 2026).
- WordPress runs 39.6% of all websites (W3Techs, Oct 2026).
- 84% of developers use or plan to use AI tools in their work (Stack Overflow, Jul 2025).
How big is the web design industry?
The trade is small next to the number of sites it serves, and it is still growing. The federal count is in the low hundreds of thousands of jobs, split between in-house staff and one-person shops.
How many people work in web design?
Web and digital interface designers held about 132,700 jobs in 2025 (BLS, Aug 2026).
- Web developers held about 87,400 jobs in 2025 (BLS, Aug 2026).
- BLS projects 231,400 combined jobs by 2035, a gain of 11,300 (BLS, Aug 2026).
- Designer jobs are projected to grow 6%, or 8,000 jobs, from 2025 to 2035 (BLS, Aug 2026).
- Developer jobs are projected to grow 4%, or 3,300 jobs, over the same decade (BLS, Aug 2026).
- About 13,600 openings a year are projected, many from workers who leave the field (BLS, Aug 2026).
Where do web designers and developers work?
The largest single employer group for designers is the information sector, at 27% of jobs (BLS, Aug 2026).
- 13% of web and digital interface designers are self-employed (BLS, Aug 2026).
- 21% of web developers work in computer systems design and related services (BLS, Aug 2026).
- 18% of web developers are self-employed (BLS, Aug 2026).
What drives demand, and what could slow it?
BLS ties demand to online selling. It expects employment to grow as e-commerce expands and retailers add online offerings (BLS, Aug 2026).
- BLS also says better development tools and AI may soften growth and let workers in other jobs do basic web tasks (BLS, Aug 2026).
- US retail e-commerce sales were $340.2 billion in the second quarter of 2026 (Census Bureau, Aug 2026).
- E-commerce made up 17.1% of total retail sales that quarter, seasonally adjusted (Census Bureau, Aug 2026).
- E-commerce sales rose 12.2% from a year earlier, while total retail sales rose 6.7% (Census Bureau, Aug 2026).
How much do web designers and developers earn?
Pay is the strongest case for the trade. Both roles sit well above the national median, and the spread inside each role is wide. One caveat: BLS wage data leaves out self-employed workers, so freelance income is not in these numbers.
What is the median pay for web developers and designers?
Web developers and digital designers together had a median of $99,520 a year, or $47.85 an hour, in 2025 (BLS, Aug 2026).
- Web developers had a median annual wage of $92,650 in May 2025 (BLS, Aug 2026).
- Computer occupations as a group had a median of $109,470 (BLS, Aug 2026).
- BLS notes its wage data does not cover self-employed workers (BLS, Aug 2026).
How wide is the pay range?
The lowest-paid tenth of designers earned less than $53,750, and the top tenth earned more than $201,550 (BLS, Aug 2026).
- The lowest-paid tenth of developers earned less than $48,100 (BLS, Aug 2026).
- The top tenth of developers earned more than $162,290 (BLS, Aug 2026).
Which industries pay web designers the most?
Designers in finance and insurance had a median of $133,260 (BLS, Aug 2026).
- Designers in the information sector had a median of $130,140 (BLS, Aug 2026).
- Designers in computer systems design had a median of $109,990 (BLS, Aug 2026).
- Designers in wholesale trade had a median of $87,640 (BLS, Aug 2026).
- Developers in the information sector had a median of $119,940 (BLS, Aug 2026).
- Developers in computer systems design had a median of $88,690 (BLS, Aug 2026).
- Developers in management and technical consulting had a median of $86,690 (BLS, Aug 2026).
How much does a website project cost?
Prices swing with scope, location and the tools used. The most useful number for a buyer is the typical project, not the average, because a few very large projects pull the average up. All figures here come from Clutch, which builds them from verified client reviews.
What do agencies charge for a website?
Web design agencies typically charge from $2,000 to $100,000 a project, depending on size, design complexity and features (Clutch, Sep 2026).
- The average project cost in verified reviews is $38,105, well above the typical project because of a few large ones (Clutch, Sep 2026).
- Most reviewed projects last 7 months (Clutch, Sep 2026).
- The average monthly cost of a reviewed project is $5,279.79 (Clutch, Sep 2026).
- Agencies that build on Wix, WordPress, Squarespace, Webflow or Shopify charge $25 to $49 an hour (Clutch, Sep 2026).
How does location change the rate?
Hourly rates for US and Canadian agencies sit in the $100 to $149 band (Clutch, Sep 2026).
- UK agencies charge $50 to $99 an hour (Clutch, Sep 2026).
- Poland, Spain, Mexico and Ukraine sit at $25 to $49 an hour (Clutch, Sep 2026).
- India and the Philippines sit below $25 an hour (Clutch, Sep 2026).
- Clutch built the guide from a database of over 79,260 web design agencies (Clutch, Sep 2026).
What makes projects run late or over budget?
Clutch names five scope items that move the price: site size, features, style, copywriting and SEO (Clutch, Sep 2026).
- Webflow’s survey covers 1,000 marketing and technical leaders at enterprises with 50 or more employees, so small shops may see different results (Webflow, Jul 2025).
- 92% of those organizations say website update requests are growing in size and complexity (Webflow, Jul 2025).
- 95% of marketing leaders say current website governance practices limit how well they can manage the site (Webflow, Jul 2025).
- 97% of technical leaders say technical debt significantly affects their ability to manage the website (Webflow, Jul 2025).
Scope, price, schedule and who approves changes are the points that go wrong most often, and each one is easier to settle in writing before work starts.
Who builds small business websites?
Most small businesses now have a site, and the build is split between agencies and in-house effort. Freelancers are a small slice of the work that small businesses outsource. The data below is a survey of small business owners, not a census of sites.
How many small businesses have a website?
The survey of 406 US small business owners ran on August 5, 2025 (Clutch, Aug 2025).
- 12% of small businesses launched a site in the past year (Clutch, Aug 2025).
- Among the 17% without a site, 34% say a website is not relevant to their industry (Clutch, Aug 2025).
- Only 16% of those without a site cite cost as the main reason, down from 26% in 2018 (Clutch, Aug 2025).
- Referrals are the top lead source for 39% of businesses without a site (Clutch, Aug 2025).
Who builds the site, and with which tools?
37% of small business sites were built in-house (Clutch, Aug 2025).
- 9% were built by the business owner (Clutch, Aug 2025).
- 1% were handed to a friend or family member (Clutch, Aug 2025).
- 41% used no-code builders such as Wix or Squarespace (Clutch, Aug 2025).
- 34% used low-code platforms such as WordPress or Shopify (Clutch, Aug 2025).
- 12% used custom development for a full-code site (Clutch, Aug 2025).
How often do sites get changed or rebuilt?
81% of small businesses have redesigned their site at least once (Clutch, Aug 2025).
- 61% update their site at least once a week (Clutch, Aug 2025).
- Among businesses with a site, 40% say SEO is their top lead source (Clutch, Aug 2025).
A site that changes every week, with more than one party editing it, needs clear terms on who owns the files, who makes edits and what counts as extra work.
What do clients and visitors expect from a website?
Owners plan to keep spending, and visitors judge the result on small details. Design counts, but so do spelling, working links and a padlock in the address bar.
What do small business owners plan to buy next?
90% of small businesses plan to invest in their website over the next 12 months (Clutch, Aug 2025).
- Their top priorities are a redesign or refresh (58%), speed (53%) and a better mobile experience (45%) (Clutch, Aug 2025).
- Content marketing (38%), SEO (37%), security updates (34%) and e-commerce or payment tools (32%) follow (Clutch, Aug 2025).
What makes a visitor trust a site?
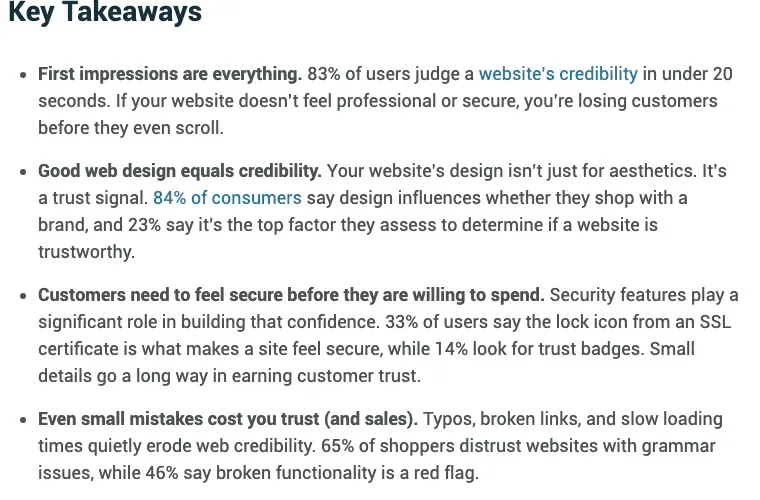
84% of consumers say design influences whether they shop with a brand (Clutch, Jun 2025).
- 33% say the lock icon from an SSL certificate is what makes a site feel secure (Clutch, Jun 2025).
- 65% of shoppers distrust sites with typos, bad grammar or placeholder text (Clutch, Jun 2025).
- 46% name broken links and 404 errors as a red flag (Clutch, Jun 2025).
How fast do visitors judge a website?
Faster than most clients expect. The window is measured in milliseconds for looks and in seconds for staying or leaving, and the research on it is old but has held up.
How long does a first impression take?
A 2006 peer-reviewed study of how fast people judge web pages set the window for a good first impression at 50 milliseconds (Behaviour and Information Technology, Mar 2006).
- 28% of consumers in a Clutch survey judge a site almost immediately (Clutch, Jun 2025).
- 55% form an opinion within 10 to 20 seconds (Clutch, Jun 2025).
- Only 13% wait until they have fully used the site (Clutch, Jun 2025).
- 45% say the first impression completely shapes whether they engage further (Clutch, Jun 2025).
How long do visitors stay, and how much do they read?
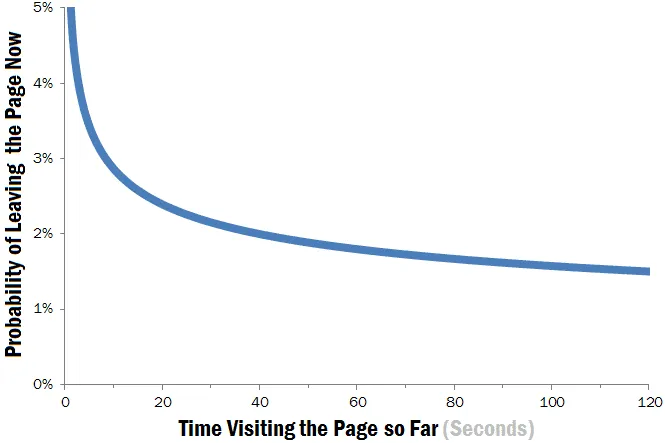
Users often leave a page within 10 to 20 seconds, and a clear value statement can hold them for much longer (Nielsen Norman Group, Sep 2011).
- Researchers found that 99% of web pages show a falling chance of leaving the longer a visitor stays (Nielsen Norman Group, Sep 2011).
- On an average page users have time to read at most 28% of the words, and 20% is more likely (Nielsen Norman Group, May 2008).
- 17% of page views in the study lasted under 4 seconds (Nielsen Norman Group, May 2008).
- Each added 100 words buys only 4.4 seconds of extra time on the page (Nielsen Norman Group, May 2008).
How much web use happens on a phone?
Most of it. Pew finds near-universal internet use among US adults, and StatCounter shows phones carrying the largest share of page views worldwide. Google also ranks sites from their mobile version.
How many people are online, and how often?
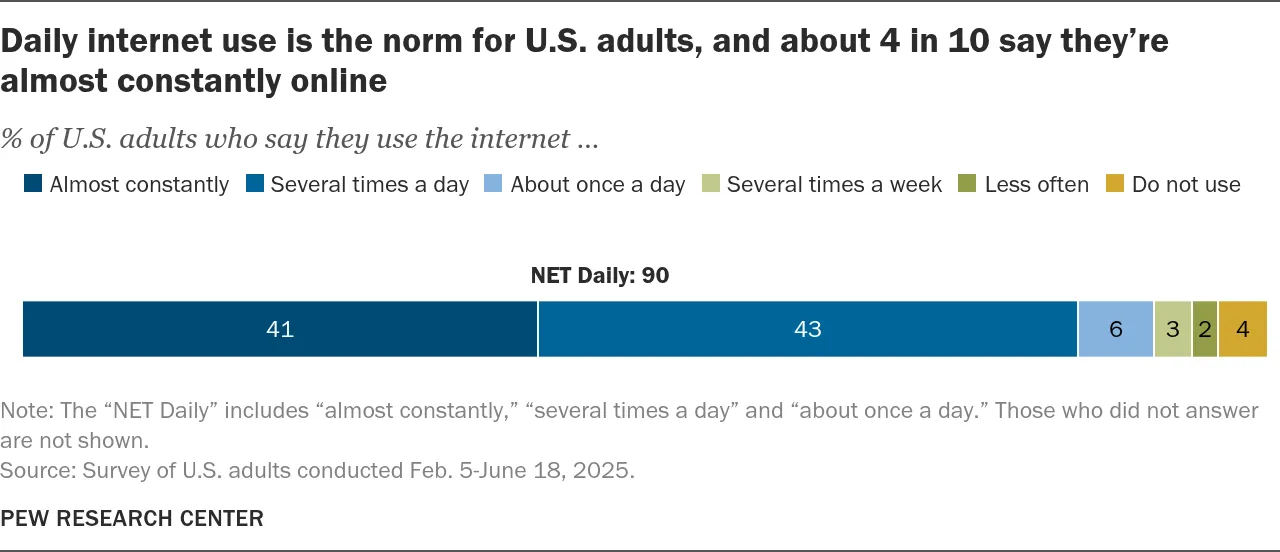
97% of US adults say they use the internet (Pew Research Center, Oct 2026).
- Nine in ten US adults use the internet daily, and 41% say they are online almost constantly (Pew Research Center, Jun 2025).
- 63% of adults ages 18 to 29 say they are online almost constantly (Pew Research Center, Jun 2025).
Which devices carry the traffic?
Desktop held 39.26% of worldwide web usage in September 2026 (StatCounter, Sep 2026).
- Tablets held 1.76% (StatCounter, Sep 2026).
- Google uses the mobile version of a site’s content for indexing and ranking (Google Search Central, Dec 2025).
- Images are the largest content element on 76% of mobile pages, and text is the largest on 23.7% (HTTP Archive, Jan 2026).
How heavy are pages on a phone?
The median mobile home page weighs 2.6 MB, up 8.4% from 2.4 MB a year earlier (HTTP Archive, Jan 2026).
- The median desktop home page weighs 2.9 MB, up 7.3% (HTTP Archive, Jan 2026).
- The median mobile home page carries 632 KB of JavaScript and 911 KB of images (HTTP Archive, Jan 2026).
- Inner pages grew 9.5% in a year, to about 1.8 MB on mobile (HTTP Archive, Jan 2026).
How fast are websites today?
Slowly improving, and still short of the mark on phones. Google’s Core Web Vitals set the bar: how fast the main content shows, how quickly the page reacts, and how steady the layout stays.
What share of sites pass Core Web Vitals?
Desktop sites with good Core Web Vitals edged up from 55% to 56% in 2025, while mobile gained four points (HTTP Archive, Jan 2026).
- Among the top 1,000 sites, 51% of mobile sites have good Core Web Vitals (HTTP Archive, Jan 2026).
- On mobile, 45% of home pages pass, against 56% of secondary pages (HTTP Archive, Jan 2026).
- 62% of sites on phones have a good Largest Contentful Paint, against 74% on desktop (HTTP Archive, Jan 2026).
- 77% of sites on phones have good Interaction to Next Paint, against 97% on desktop (HTTP Archive, Jan 2026).
- 81% of mobile pages have good Cumulative Layout Shift, against 72% on desktop (HTTP Archive, Jan 2026).
What slows pages down?
Median mobile Total Blocking Time reached 1,916 milliseconds, up 58% in a year (HTTP Archive, Jan 2026).
- 85.3% of desktop pages have an image as their largest element (HTTP Archive, Jan 2026).
- JPG is still the format for 57% of those largest images, and WebP for 11% (HTTP Archive, Jan 2026).
- About 16% of pages lazy-load their largest image, which delays it (HTTP Archive, Jan 2026).
- 62% of mobile pages leave at least one image without set dimensions (HTTP Archive, Jan 2026).
Does the platform change the result?
Wix raised its share of mobile sites with good Core Web Vitals from 55% to 74% in a year (HTTP Archive, Jan 2026).
- Duda leads with 85% of its mobile sites passing (HTTP Archive, Jan 2026).
- WordPress sits near the bottom at 45% (HTTP Archive, Jan 2026).
- Squarespace leads on interaction speed, with 96% of mobile sites having good Interaction to Next Paint (HTTP Archive, Jan 2026).
Does site speed change sales?
Yes, in every study that tested it, and the effect shows up in small slices of time. The studies differ in method and age, so treat the exact figures as direction, not a promise for any one site.
How much does load time move conversion?
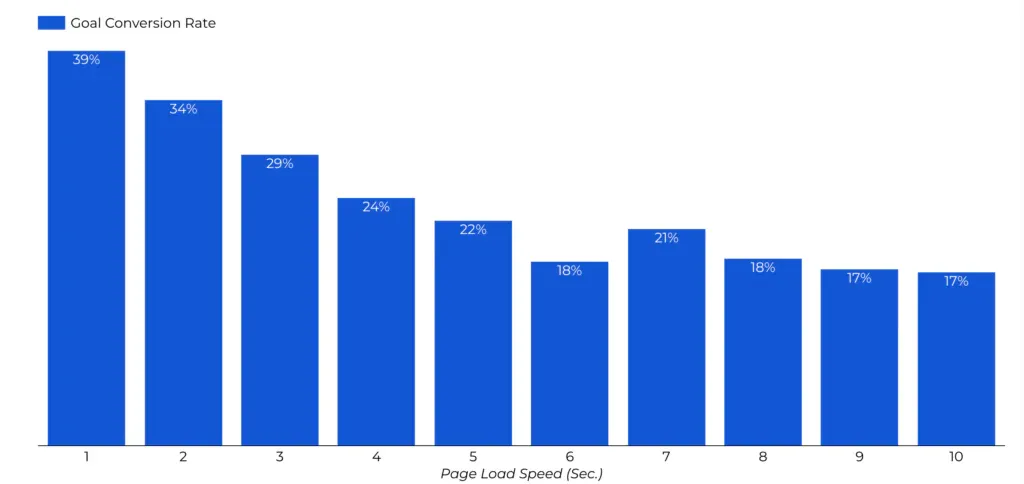
Portent’s study of lead generation sites found goal conversion fell from almost 40% at one second to 34% at two and 29% at three (Portent, Apr 2022).
- A lead generation site loading in one second converts 3x higher than one loading in five (Portent, Apr 2022).
- E-commerce conversion was 3.05% at one second (Portent, Apr 2022).
- E-commerce conversion drops by an average of 0.3% for every added second (Portent, Apr 2022).
- Portent’s sample was just over 100 million page views across 20 B2B and B2C sites (Portent, Apr 2022).
What did controlled tests find?
Vodafone ran an A/B test and found a 31% better Largest Contentful Paint led to 8% more sales (web.dev, Mar 2021).
- The same test lifted the lead-to-visit rate by 15% (web.dev, Mar 2021).
- It lifted the cart-to-visit rate by 11% (web.dev, Mar 2021).
- Deloitte studied 37 brands over four weeks, and a 0.1 second gain raised travel conversions by 10.1% (Deloitte, Mar 2020).
- The same 0.1 second gain raised retail average order value by 9.2% (Deloitte, Mar 2020).
- Bounce rate on lead generation informational pages improved by 8.3% (Deloitte, Mar 2020).
What did Google find about mobile load times?
Google measured the average mobile landing page at 22 seconds to fully load (Think with Google, Mar 2017).
- As load time goes from one second to seven, the chance a mobile visitor bounces rises 113% (Think with Google, Mar 2017).
- 70% of the mobile pages Google analyzed were over 1 MB (Think with Google, Mar 2017).
How many shoppers leave before they buy?
Baymard’s average of 50 studies puts online cart abandonment at 70.22% (Baymard Institute, Sep 2025).
How accessible are websites?
Most are not, and the trend turned the wrong way in 2026. WebAIM tests the home pages of the top one million sites each year with an automated engine, so the real picture is worse than the counts below.
How many errors does a typical home page have?
WebAIM detected 56.1 errors per home page in February 2026, up 10.1% from 51 a year earlier (WebAIM, Feb 2026).
- Only 20.5% of pages had five or fewer detected errors (WebAIM, Feb 2026).
- Pages had an average of 1,437 page elements, up 14.3% in a year (WebAIM, Feb 2026).
- WebAIM said the rise likely reflects more third-party frameworks and automated or AI-assisted coding (WebAIM, Feb 2026).
Which failures show up most?
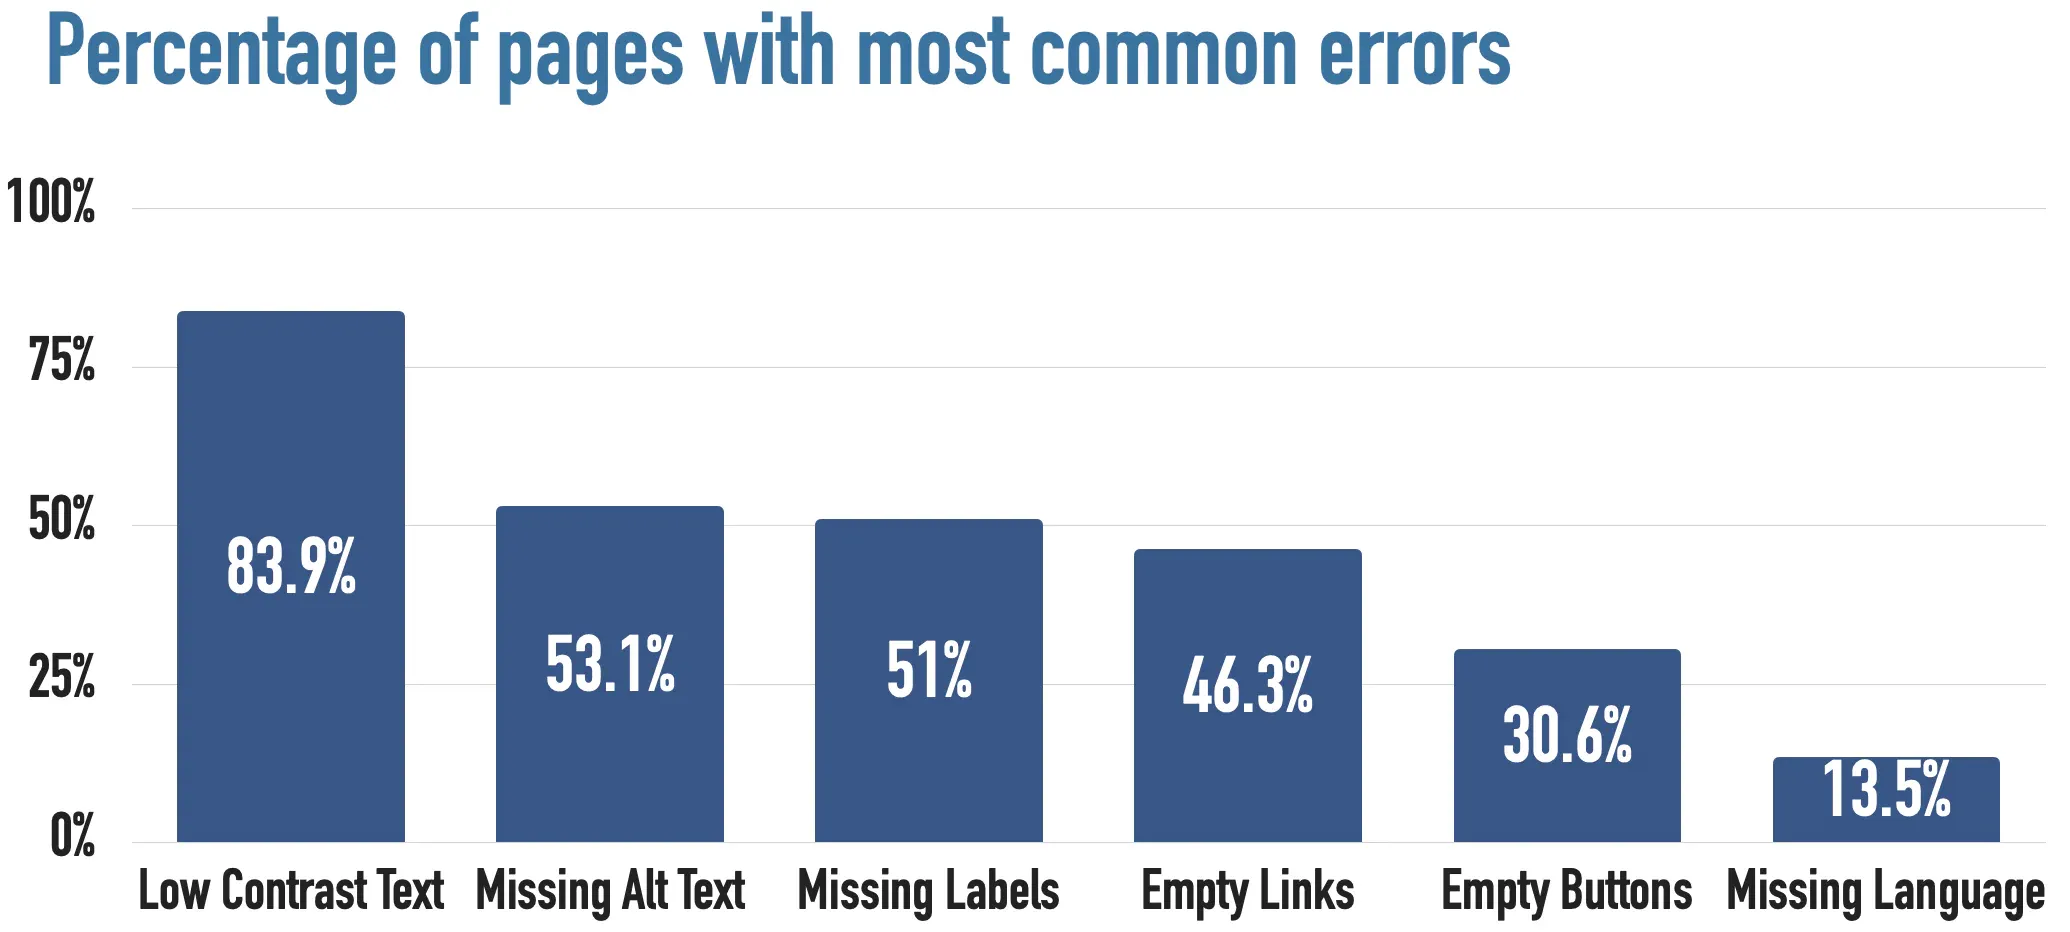
Low contrast text appeared on 83.9% of home pages (WebAIM, Feb 2026).
- Missing image alternative text appeared on 53.1% (WebAIM, Feb 2026).
- Missing form input labels appeared on 51% (WebAIM, Feb 2026).
- Empty links appeared on 46.3% (WebAIM, Feb 2026).
- Empty buttons appeared on 30.6% (WebAIM, Feb 2026).
- A missing document language appeared on 13.5% (WebAIM, Feb 2026).
- Those six categories made up 96% of all detected errors (WebAIM, Feb 2026).
- 16.2% of home page images had no alternative text (WebAIM, Feb 2026).
- Skipped heading levels appeared on 41.8% of pages (WebAIM, Feb 2026).
What do phones and styling choices do to access?
Only 31% of mobile sites meet the minimum color contrast requirement (HTTP Archive, Jan 2026).
- 67% of sites remove default focus outlines, up 14% from 2024 (HTTP Archive, Jan 2026).
- 19% of mobile sites restrict zooming (HTTP Archive, Jan 2026).
Do tools and platforms change the result?
Home pages using ARIA averaged 59.1 detected errors, against 42 for pages without it (WebAIM, Feb 2026).
- Wix home pages averaged 33.3 errors, against 33.0 for Squarespace (WebAIM, Feb 2026).
- WordPress home pages averaged 52.8 errors (WebAIM, Feb 2026).
- Shopify home pages averaged 75.1 errors (WebAIM, Feb 2026).
- Government home pages averaged 42.4 errors, and shopping pages averaged 71.0 (WebAIM, Feb 2026).
Who is affected, and what do the rules say?
More than 1 in 4 US adults have some type of disability (CDC, May 2026).
- 71.6% of screen reader users in a 1,539-person survey navigate by headings (WebAIM, Feb 2024).
- CAPTCHA was the most problematic item in the same survey, by a notable margin (WebAIM, Feb 2024).
- The Department of Justice published a rule in April 2024 setting technical requirements for state and local government websites and mobile apps (ADA.gov, Apr 2026).
- An April 2026 interim final rule moved the compliance date to April 26, 2027 for entities with a population of 50,000 or more (ADA.gov, Apr 2026).
- The date for smaller entities and special districts moved to April 26, 2028 (ADA.gov, Apr 2026).
Which platforms and tools build the web?
One platform dominates, a third of sites use none, and AI tools are now routine for developers. Pick the platform before the design, because it sets the speed and access baseline.
Which content management systems lead?
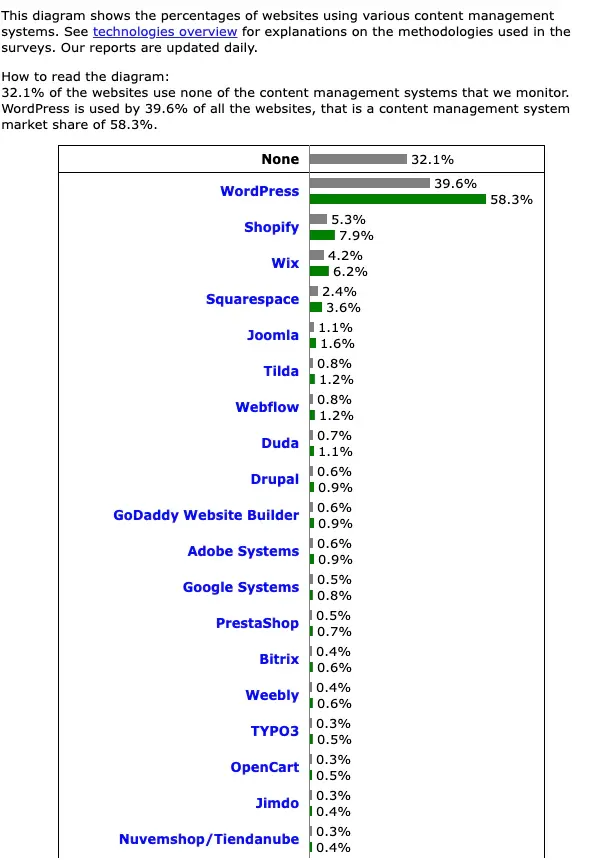
32.1% of websites use none of the content management systems W3Techs monitors (W3Techs, Oct 2026).
- WordPress holds a 58.3% share of the content management system market (W3Techs, Oct 2026).
- Shopify is used by 5.3% of all websites (W3Techs, Oct 2026).
- Wix is used by 4.2% of all websites and Squarespace by 2.4% (W3Techs, Oct 2026).
- Webflow is used by 0.8% (W3Techs, Oct 2026).
- Over 54% of sites use a content management system, and WordPress powers about 64% of those on mobile (HTTP Archive, Jan 2026).
- Elementor’s share of page builder use fell from about 56% to 43% (HTTP Archive, Jan 2026).
- Around 60% of WordPress sites are estimated to use a page builder (HTTP Archive, Jan 2026).
- Wix, Squarespace, WordPress and Shopify are used by 75% of small businesses surveyed (Clutch, Aug 2025).
How are developers and teams using AI?
51% of professional developers use AI tools every day (Stack Overflow, Jul 2025).
- 60% of respondents view AI tools favorably, down from over 70% in 2023 and 2024 (Stack Overflow, Jul 2025).
- JavaScript is used by 68.8% of professional developers and HTML/CSS by 63% (Stack Overflow, Jul 2025).
- 52% of marketing leaders will prioritize optimization for AI-driven search and summaries in 2026 (Webflow, Jul 2025).
- GPTBot is named in 4.5% of desktop robots.txt files, up from 2.9% (HTTP Archive, Jan 2026).
Glossary
- ARIA: a set of HTML attributes that add accessibility information to page elements.
- CAPTCHA: a test that asks a visitor to prove they are human.
- CLS (Cumulative Layout Shift): a score for how much a page layout jumps while it loads.
- CMS (content management system): software that lets people edit a site without code.
- Core Web Vitals: Google’s three page experience metrics: LCP, INP and CLS.
- INP (Interaction to Next Paint): how quickly a page responds to a tap or click.
- LCP (Largest Contentful Paint): how long the largest visible element takes to appear.
- TBT (Total Blocking Time): time a page is frozen while scripts run during load.
- WCAG: the Web Content Accessibility Guidelines from the W3C.
Methodology and Sources
Each figure was taken from the page or file of the agency, research team or company that produced it, opened on 20 October 2026, and checked against the exact sentence or chart. Aggregator and roundup pages were used only to find leads. Survey data from Clutch and Webflow comes from small or specialist samples, which the text states. Older studies from Think with Google, Deloitte and Nielsen Norman Group are included as foundational research and are dated in each citation. The page is refreshed monthly, and the full source list follows.
Sources
- U.S. Bureau of Labor Statistics, Occupational Outlook Handbook: Web Developers and Digital Designers
- Clutch, The State of Small Business Websites in 2025
- Clutch, Web Design Company Pricing Guide 2026
- Webflow, The 2026 State of the Website
- Lindgaard, Fernandes, Dudek and Brown, Behaviour and Information Technology, Mar 2006
- StatCounter Global Stats, Desktop vs Mobile vs Tablet Market Share Worldwide
- HTTP Archive, Web Almanac 2025: Performance
- Deloitte, Milliseconds Make Millions
- Think with Google, Mobile Page Speed New Industry Benchmarks
- WebAIM, The WebAIM Million 2026
- W3Techs, Usage Statistics and Market Share of Content Management Systems
- Stack Overflow, 2025 Developer Survey: AI
- U.S. Census Bureau, Quarterly Retail E-Commerce Sales, 2nd Quarter 2026
- Webflow, The 2026 State of the Website: Methodology
- Clutch, What Trustworthy Websites Look Like in 2025
- Nielsen Norman Group, How Long Do Users Stay on Web Pages?
- Nielsen Norman Group, How Little Do Users Read?
- Pew Research Center, Americans’ Use of Internet, Broadband in 2026
- Pew Research Center, Internet use, smartphone ownership, digital divides in the US
- Google Search Central, Mobile site and mobile-first indexing best practices
- HTTP Archive, Web Almanac 2025: Page Weight
- HTTP Archive, Web Almanac 2025: CMS
- Portent, Site Speed is (Still) Impacting Your Conversion Rate
- web.dev, Vodafone: A 31% improvement in LCP increased sales by 8%
- Baymard Institute, Cart Abandonment Rate Statistics
- HTTP Archive, Web Almanac 2025: Accessibility
- CDC, Disability Impacts All of Us
- WebAIM, Screen Reader User Survey #10
- ADA.gov, First Steps Toward Complying with the ADA Title II Web and Mobile Application Accessibility Rule
- Stack Overflow, 2025 Developer Survey: Technology
- HTTP Archive, Web Almanac 2025: SEO