Self employed business owner income statistics point to one fact first: most people who run their own business run it alone, and most of those businesses bring in modest money. The typical one is a sole proprietorship that the owner treats as a job, a side income or both.
This page gathers the numbers that answer the common questions. How many people work for themselves, what do they earn, which industries pay, what do they owe in tax, and what happens to health cover, retirement and survival. Every figure comes from the agency or survey that produced it, and each one is dated. Last updated October 2026. Freelancer pay and platform work sit on the freelance statistics and gig economy statistics pages, and solo founders are on the solopreneur statistics page.
Two cautions apply. First, “income” means different things in each dataset: receipts are sales before costs, net income is what is left, and survey answers are what owners say. Second, several averages on this page are our own division of published totals, and the text says so each time.
Key Takeaways
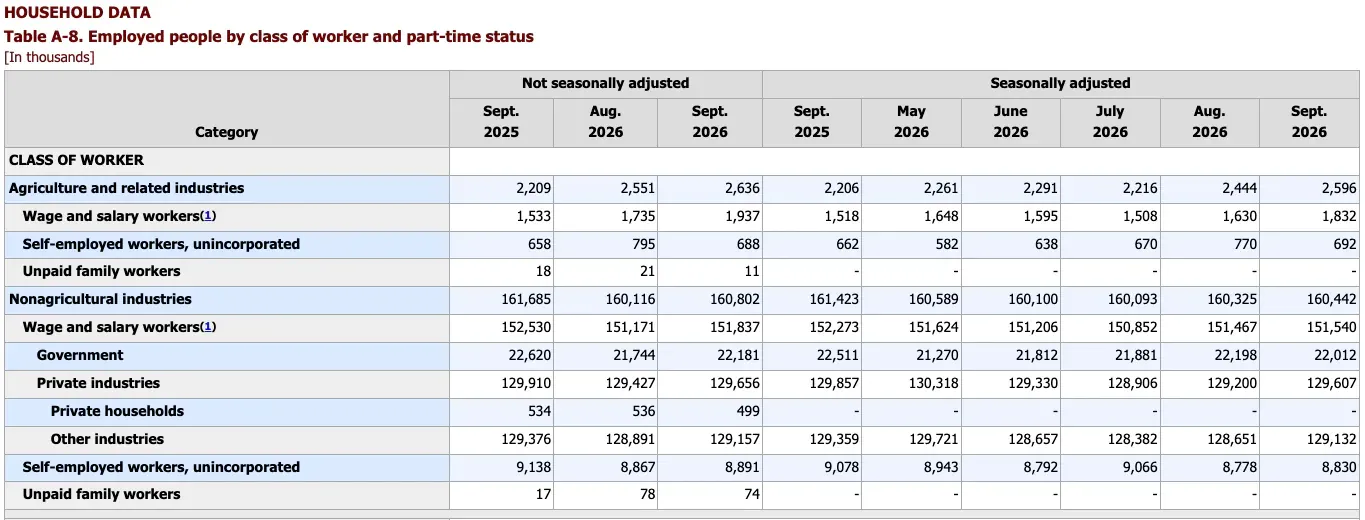
- The 2025 annual average was 9.16 million unincorporated self-employed workers outside farming and 680,000 in farming (U.S. Bureau of Labor Statistics, Dec 2025).
- The US had 31,985,874 nonemployer businesses in 2024, with $1.86 trillion in receipts (U.S. Census Bureau, Sep 2026).
- Census compared nonemployer receipts of $1.8 trillion in 2023 with about 6.4% of US gross domestic product (U.S. Census Bureau, Jul 2025).
- Small businesses make up 43.5% of US gross domestic product (SBA Office of Advocacy, Feb 2026).
- 66.7% of photographers and 54.9% of real estate brokers are self-employed (U.S. Bureau of Labor Statistics, Aug 2026).
- Nonfarm sole proprietors reported $377.2 billion in net income less deficit for tax year 2023 (Internal Revenue Service, Mar 2026).
- 59% of employer firms with 20 to 49 employees were profitable at the end of 2024, against 43% of those with 1 to 4 employees (Federal Reserve Banks, Mar 2026).
- Self-employment tax is 12.4% for Social Security on up to $184,500 of net earnings in 2026, plus 2.9% for Medicare on all of it (Social Security Administration, May 2026).
- 946,019 returns reported payments to a Keogh plan in tax year 2023, totalling $30.1 billion (Internal Revenue Service, Mar 2026).
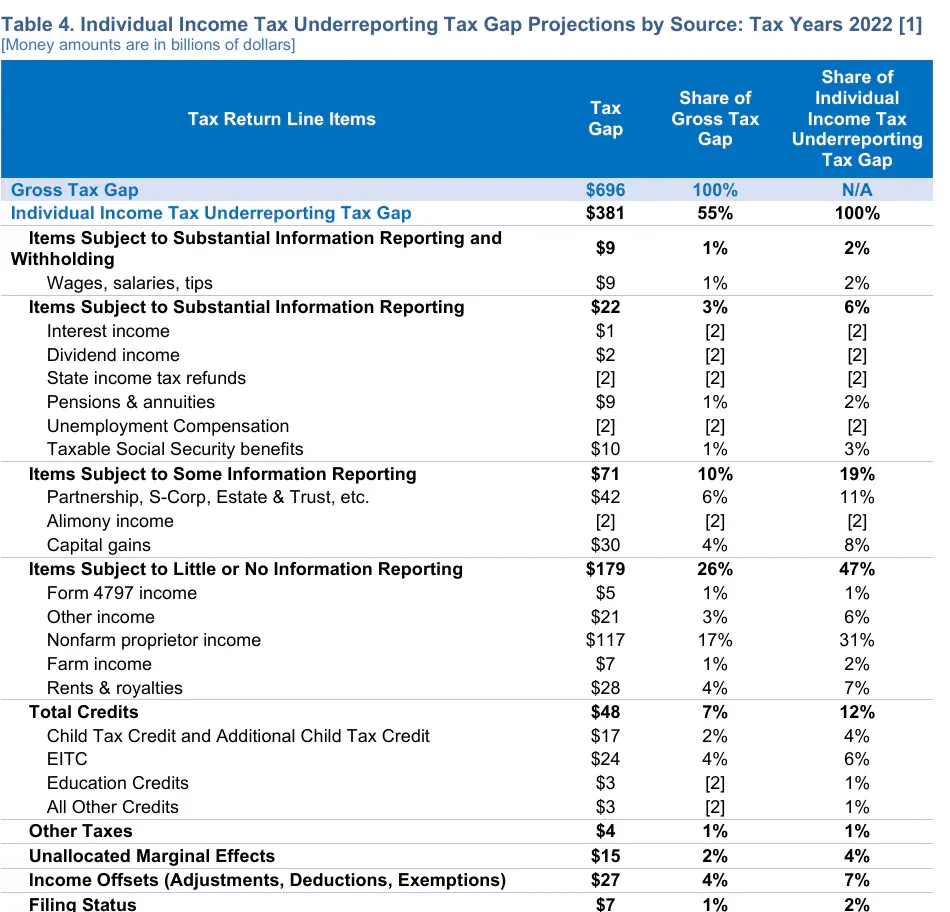
- Underreported nonfarm proprietor income accounts for $117 billion of the tax year 2022 tax gap (Internal Revenue Service, Oct 2024).
- 3.3 million small business owners and self-employed adults had Marketplace health coverage in 2022, 28% of working-age Marketplace enrollment (HHS ASPE, Nov 2024).
- 51.9% of private establishments opened in the year to March 2018 were still open five years later (U.S. Bureau of Labor Statistics, Mar 2025).
- 12% of working adults said they were self-employed in their main job, and 17% of those who work for themselves owned a business with paid employees (Federal Reserve Board, May 2026).
How many people are self-employed in the US?
The headline count of self-employed workers is smaller than most people guess. The wider count of people who earn some money from a business of their own is much larger, because many of them also hold a paycheck job.
How many workers run an unincorporated business?
- The seasonally adjusted nonfarm count was 8.83 million in September 2026, against 9.08 million a year earlier (U.S. Bureau of Labor Statistics, Sep 2026).
- Men held 5.34 million of the nonfarm unincorporated self-employed jobs in 2025 and women held 3.82 million (U.S. Bureau of Labor Statistics, Dec 2025).
- The 35 to 44 age group was the largest at 2.06 million, and 1.35 million people aged 65 and over were still self-employed outside farming (U.S. Bureau of Labor Statistics, Dec 2025).
How many people earn something from self-employment?
- About 33 million people, or 17.3% of workers, had some self-employment income in 2019, a wider count than the BLS series because it includes people who also hold a wage job (U.S. Census Bureau, Sep 2025).
- 9.5% of workers combined a wage job with self-employment income in that year (U.S. Census Bureau, Sep 2025).
- 12.2% of workers aged 55 and older had self-employment income only, against 2.9% of workers under 35 (U.S. Census Bureau, Sep 2025).
- Of workers whose only 2018 income was self-employment, 73.5% had the same pattern in 2019, and 16.5% had no paid work at all in 2019 (U.S. Census Bureau, Sep 2025).
- 18.0% of people who found work in 2019 after not working in 2018 had some self-employment income (U.S. Census Bureau, Sep 2025).
- 52.8% of business ownership jobs belonged to an owner who also had wage and salary income (U.S. Census Bureau, Sep 2025).
How many small businesses have no employees?
Most US businesses are one-person operations, and the gap between them and employers keeps widening. Counting them matters because their owners pay themselves from profit, not from payroll.
How are nonemployer businesses organized?
- The US had 36,207,130 small businesses in 2022 and 21,041 large ones (SBA Office of Advocacy, Feb 2026).
- Employer firms numbered 6,395,635 (SBA Office of Advocacy, Feb 2026).
- 86.7% of nonemployers were sole proprietorships, while 55% of small employer firms were S corporations (SBA Office of Advocacy, Feb 2026).
- In 2024 the count included 1,489,244 S corporations, 2,367,086 partnerships and 485,357 C corporations (U.S. Census Bureau, Sep 2026).
How fast is the nonemployer count growing?
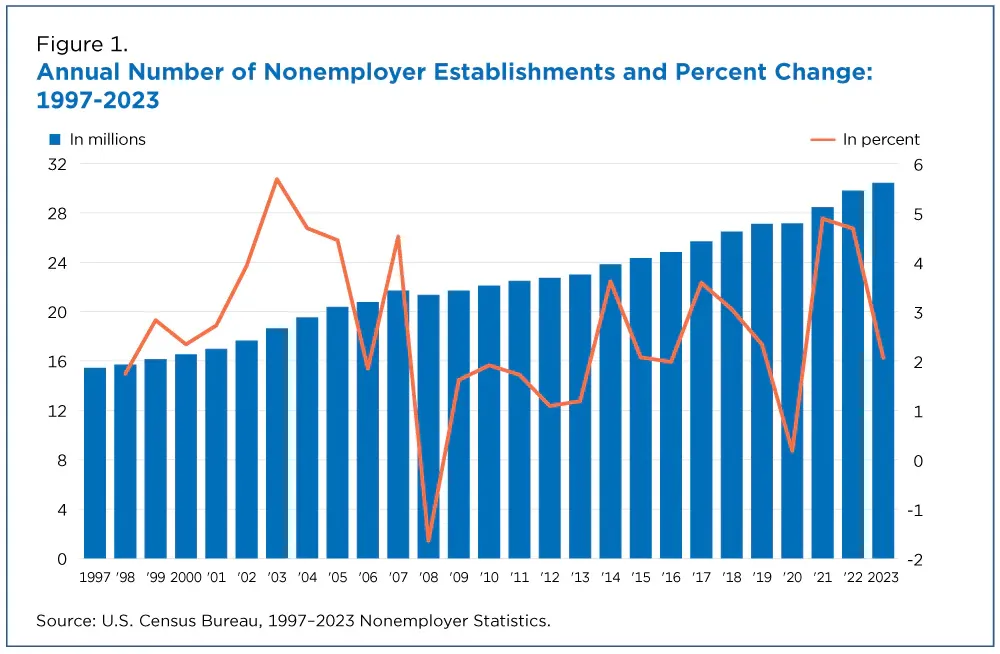
- From 2012 to 2023 nonemployers grew 2.7% a year on average, against 1.1% for employer businesses (U.S. Census Bureau, Jul 2025).
- That pace cut the employer share of all businesses from 24.6% to 21.6% (U.S. Census Bureau, Jul 2025).
- Growth hit 4.9% in 2021 and 4.7% in 2022, then eased to 2.1% in 2023 (U.S. Census Bureau, Jul 2025).
- 15 of the 18 industry sectors added nonemployers from 2022 to 2023 (U.S. Census Bureau, Jul 2025).
- Taxi and limousine service added nearly 122,000 nonemployers that year and drove the biggest gain of any three-digit industry, in transit and ground passenger transportation (U.S. Census Bureau, Jul 2025).
Where are the most nonemployers?
- California had the most in 2022 at 3,502,950, with Texas second at 3,023,525 (U.S. Census Bureau, May 2025).
- Louisiana lost 11,708 nonemployer businesses from 2022 to 2023, a 2.7% drop and the steepest fall among the states that lost any (U.S. Census Bureau, Jul 2025).
Who owns these businesses?
Ownership of the smallest firms looks closer to the population than ownership of firms with staff. The gap opens when a business hires.
How many businesses do women and veterans own?
- The US had 36.4 million employer and nonemployer businesses in 2023, with $50.0 trillion in receipts (U.S. Census Bureau, Nov 2025).
- Women owned 14.2 million of them, with $2.8 trillion in receipts (U.S. Census Bureau, Nov 2025).
- Veterans owned 1.6 million, with $1.0 trillion in receipts (U.S. Census Bureau, Nov 2025).
- Women owned 22.9% of the 5.9 million employer firms, against 42.3% of nonemployers (U.S. Census Bureau, Nov 2025).
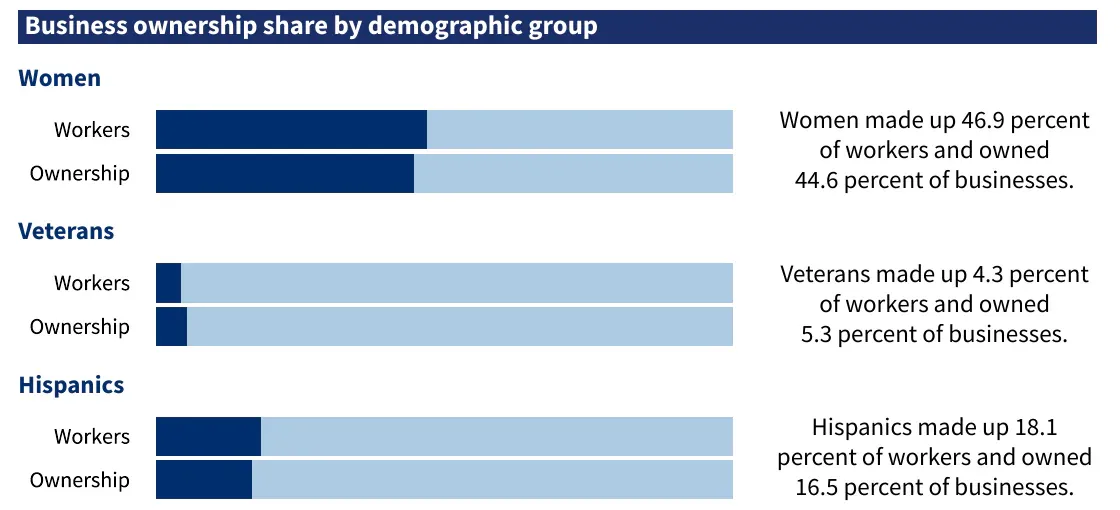
- Women made up 46.9% of workers and owned 44.6% of businesses (SBA Office of Advocacy, Jun 2025).
- Veterans made up 4.3% of workers and owned 5.3% of businesses (SBA Office of Advocacy, Jun 2025).
How do receipts differ by owner group?
- Black or African American owners held 14.4% of nonemployer businesses, with $128.7 billion in receipts (U.S. Census Bureau, Nov 2025).
- Asian owners held 9.2% of nonemployers, a smaller share, but their receipts were larger at $163.6 billion (U.S. Census Bureau, Nov 2025).
- Hispanic owners held 17.5% of nonemployers, with $244.2 billion in receipts (U.S. Census Bureau, Nov 2025).
- Hispanic Americans made up 18.1% of workers and owned 16.5% of businesses (SBA Office of Advocacy, Jun 2025).
- About one in four employer firms (26.1%) was family-owned in 2022 (SBA Office of Advocacy, Feb 2026).
- Rural areas held 4.3 million small business establishments in 2022 (SBA Office of Advocacy, Feb 2026).
What do self employed income statistics show about earnings?
Tax returns say the average sole proprietor earns far less than the headline receipts suggest. Receipts are what comes in. Net income is what is left after costs, and the two are far apart.
What do sole proprietors report on Schedule C?
- Nonfarm sole proprietors filed 31,125,909 Schedule C returns for tax year 2023, with $2.06 trillion in business receipts (Internal Revenue Service, Mar 2026).
- Net income less deficit works out to $12,119 per return, a division we made of the IRS totals (Internal Revenue Service, Mar 2026).
- 21,411,462 of those returns showed net income, with $530.8 billion in total, or about $24,790 per profitable return by our division (Internal Revenue Service, Mar 2026).
- Form 1040 filers reported a net business loss on 9,067,174 returns, with $153.4 billion in losses (Internal Revenue Service, Mar 2026).
- Sole proprietors paid $175.0 billion in payroll on those returns (Internal Revenue Service, Mar 2026).
How much revenue does the average nonemployer bring in?
- Dividing 2024 nonemployer receipts by establishments gives an average of $58,194 (U.S. Census Bureau, Sep 2026).
- Sole proprietorships averaged about $40,670 in receipts by our division, from 27,644,187 establishments (U.S. Census Bureau, Sep 2026).
- Nonemployer S corporations averaged about $169,961 in receipts and partnerships about $168,129, four times the sole proprietor figure (U.S. Census Bureau, Sep 2026).
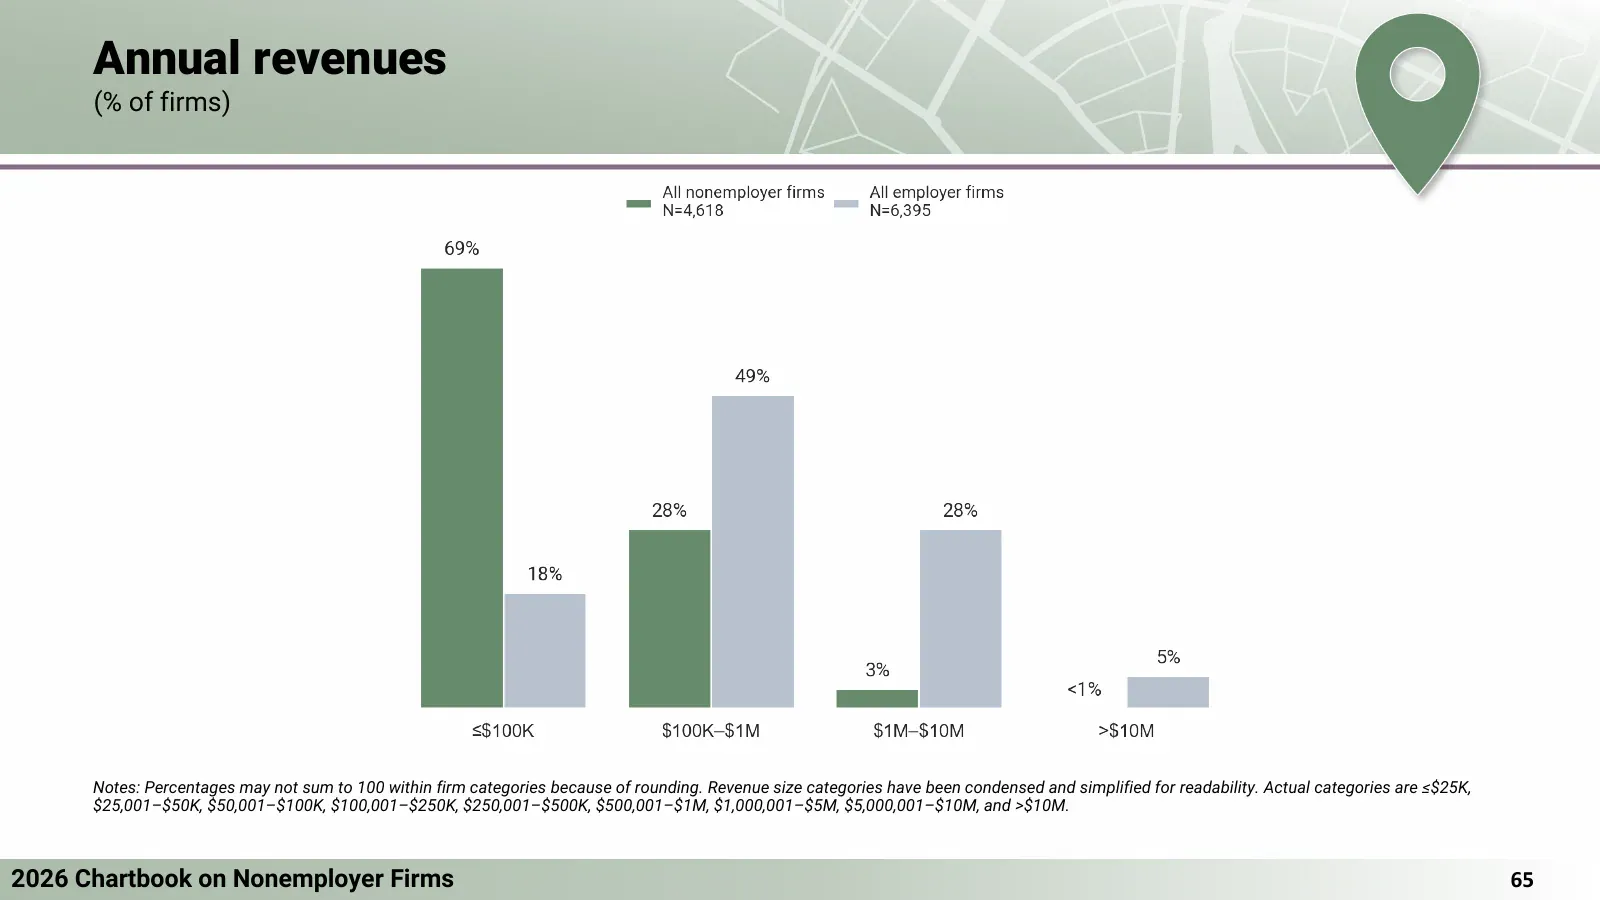
- In the Federal Reserve survey, 69% of nonemployer firms reported revenue of $100,000 or less, against 18% of employer firms (Federal Reserve Banks, Jul 2026).
- 28% of nonemployers fell between $100,000 and $1 million, and 3% between $1 million and $10 million (Federal Reserve Banks, Jul 2026).
How profitable are self-employed businesses?
Revenue is a vanity number if the business loses money. The profit data is blunter than the receipts data, and it helps explain why some owners keep another job.
How do nonemployers compare with employer firms?
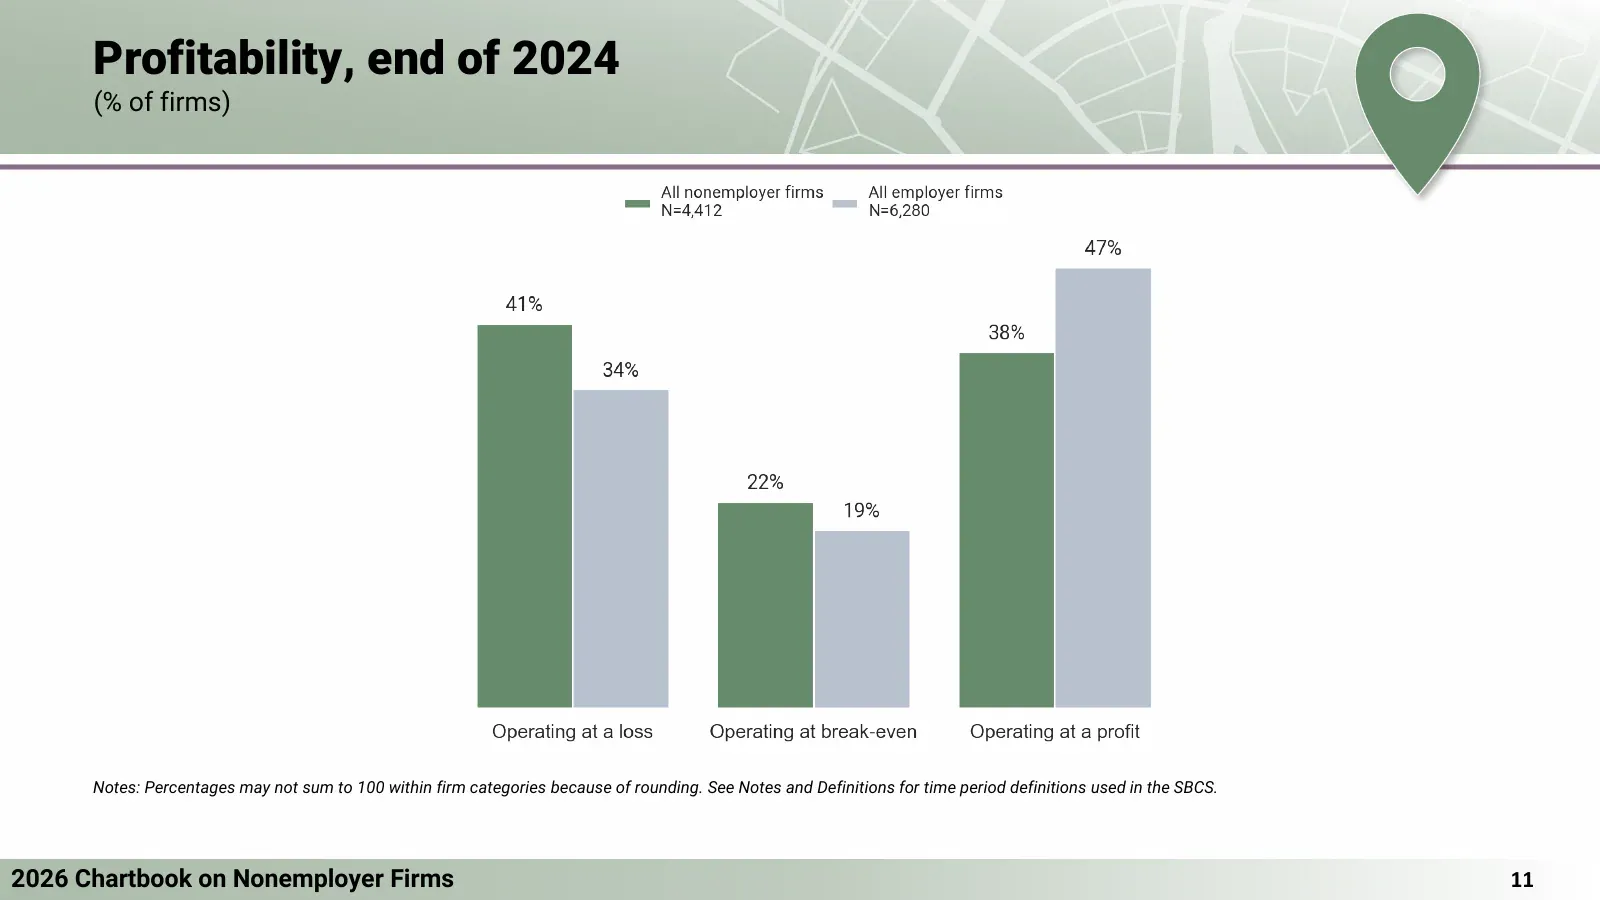
- 22% of nonemployer firms broke even at the end of 2024, against 19% of employer firms (Federal Reserve Banks, Jul 2026).
- 34% of employer firms operated at a loss, and 47% made a profit (Federal Reserve Banks, Jul 2026).
- Only 9% of nonemployers rated their financial condition very good or excellent, 6% and 3% respectively (Federal Reserve Banks, Jul 2026).
- Employer firms rated their condition poor at 22% and fair at 35% (Federal Reserve Banks, Mar 2026).
- 40% of employer firms saw revenue rise in the prior 12 months and 42% saw it fall (Federal Reserve Banks, Mar 2026).
What does the wider owner picture look like?
- 75% of nonemployer firms had a single owner and 21% had two (Federal Reserve Banks, Jul 2026).
- 18% of nonemployer firms were the main job of an owner with more than one job (Federal Reserve Banks, Jul 2026).
- NFIB’s earnings trend for small firms stood at a net -20% in September 2026, meaning more owners reported lower profits than higher (NFIB, Oct 2026).
- In the same survey a net 28% of owners reported raising compensation, and a net 20% planned to (NFIB, Oct 2026).
Which industries pay self-employed owners the most?
The same filing status gives very different results by industry. A sole proprietor in finance and one in retail are in different worlds.
Which sectors bring in the most receipts?
- Real estate, rental and leasing held 20.0% of 2022 nonemployer receipts, or $344.7 billion, on just 10.6% of establishments (U.S. Census Bureau, May 2025).
- Construction took 13.8% of receipts at $238.0 billion, and professional, scientific and technical services took 13.3% at $229.4 billion (U.S. Census Bureau, May 2025).
- In 2024, transportation and warehousing had the most nonemployer establishments at 4,484,838, ahead of professional services at 4,233,838 (U.S. Census Bureau, Sep 2026).
- Wholesale trade averaged about $134,953 per nonemployer establishment in 2024, the highest of any sector by our division, while educational services averaged about $18,746 (U.S. Census Bureau, Sep 2026).
Which sectors leave owners the most profit?
- Finance and insurance sole proprietors kept about $34,572 per return in net income less deficit in tax year 2023, the highest of any sector by our division (Internal Revenue Service, Mar 2026).
- Professional, scientific and technical services followed at about $25,388 per return by our division (Internal Revenue Service, Mar 2026).
- Retail trade sole proprietors averaged only about $3,610 per return, and transportation and warehousing about $4,205 (Internal Revenue Service, Mar 2026).
- 2,686,466 of 3,368,860 construction returns showed net income, a profit rate of about 80% (Internal Revenue Service, Mar 2026).
Where do small employers dominate?
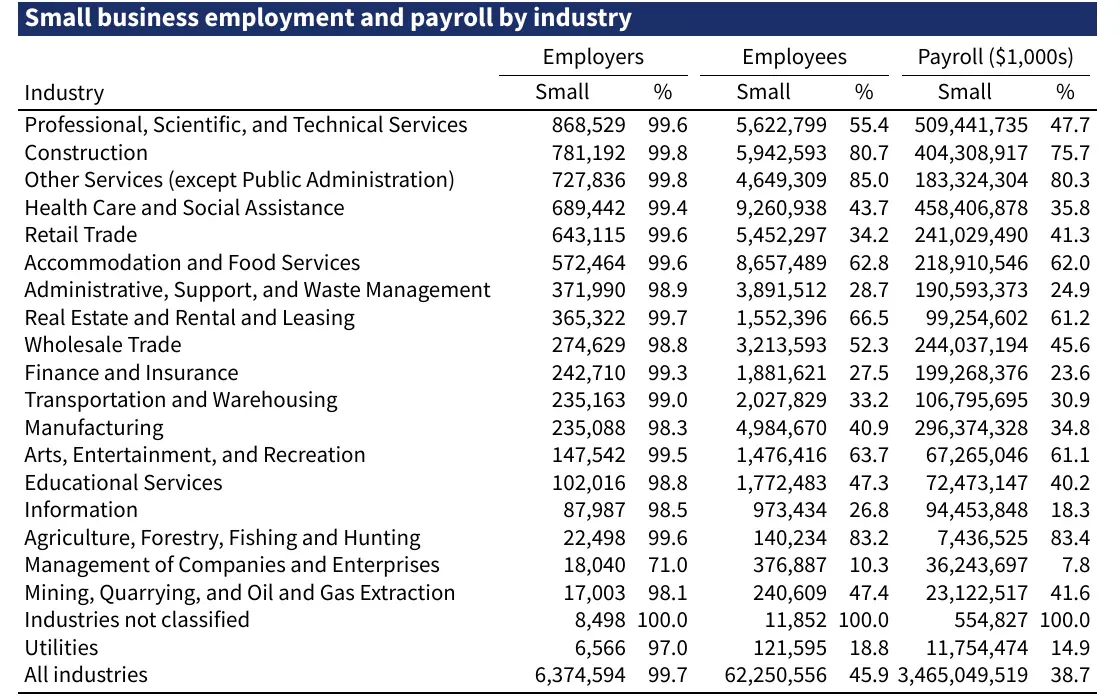
- Small firms held 85.0% of employees in other services and 80.7% in construction (SBA Office of Advocacy, Jun 2025).
- In finance and insurance they held only 27.5% of employees and 23.6% of payroll (SBA Office of Advocacy, Jun 2025).
Which jobs are most often self-employed?
- 86.5% of taxi drivers were self-employed, and so were 48.1% of hairdressers, hairstylists and cosmetologists (U.S. Bureau of Labor Statistics, Aug 2026).
- 22.8% of psychologists and 20.5% of graphic designers worked for themselves (U.S. Bureau of Labor Statistics, Aug 2026).
How does income change with business size?
A business that adds staff changes the owner’s math: revenue and payroll both rise, and profit follows a different pattern.
What do firms with employees earn?
- Employer firms with fewer than 5 employees took in about $517,316 in receipts each in 2022, by our division of Census totals (U.S. Census Bureau, Aug 2025).
- Firms with 5 to 9 employees averaged about $1.58 million in receipts, and those with 20 to 24 averaged about $5.17 million (U.S. Census Bureau, Aug 2025).
- Payroll per employee was about $56,381 at firms with fewer than 5 employees and about $45,810 at firms with 5 to 9 (U.S. Census Bureau, Aug 2025).
Does a bigger firm mean better odds of profit?
- At firms with 5 to 9 employees, 43% were profitable and 39% lost money (Federal Reserve Banks, Mar 2026).
- At 10 to 19 employees, 52% were profitable and 33% lost money (Federal Reserve Banks, Mar 2026).
- At 50 to 499 employees, 73% were profitable and 17% lost money (Federal Reserve Banks, Mar 2026).
How much of the economy do small firms produce?
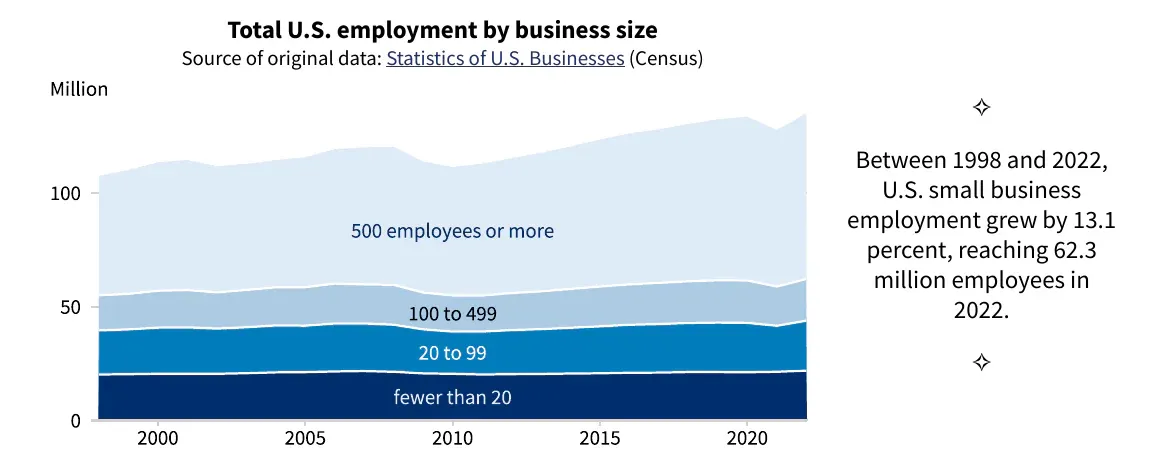
- Small business employment reached 62.3 million jobs, or 45.9% of private sector employees (SBA Office of Advocacy, Jun 2025).
- Small businesses paid 38.7% of private sector payroll, or $3.5 trillion (SBA Office of Advocacy, Feb 2026).
- They took in 35.0% of private sector receipts, or $17.8 trillion (SBA Office of Advocacy, Feb 2026).
- Small businesses created 20.7 million net new jobs from 1995 to 2024, against 13.2 million for large businesses (SBA Office of Advocacy, Feb 2026).
What do the self-employed pay in taxes?
Self-employed owners pay both halves of Social Security and Medicare, and they pay on a schedule, not through a paycheck. The IRS also sees their income less clearly than wages.
What are the self-employment tax rules?
- Sole proprietors, independent contractors and partners in partnerships all count as self-employed for this tax (Internal Revenue Service, Sep 2026).
- Additional Medicare tax applies above $250,000 for joint filers, $125,000 for separate filers and $200,000 for all others (Internal Revenue Service, Sep 2026).
- Self-employed people can deduct one-half of the self-employment tax when figuring adjusted gross income (Internal Revenue Service, Sep 2026).
- In 2026, net earnings of $7,560 earn four Social Security credits, with one credit per $1,890 (Social Security Administration, May 2026).
- Estimated tax payments are generally required when a person expects to owe $1,000 or more at filing (Internal Revenue Service, Sep 2026).
How much of this tax shows up on returns?
- 21,853,593 returns claimed the deductible half of self-employment tax in tax year 2023, for $40.5 billion (Internal Revenue Service, Mar 2026).
- 26,567,412 returns claimed the qualified business income deduction, worth $214.6 billion (Internal Revenue Service, Mar 2026).
- The qualified business income deduction can reach 20 percent of qualified business income, within taxable income limits (Internal Revenue Service, Sep 2026).
- The gross tax gap for tax year 2022 was $696 billion (Internal Revenue Service, Oct 2024).
- Self-employment tax underreporting was $71 billion of that gap, and self-employment tax nonfiling was $9 billion (Internal Revenue Service, Oct 2024).
What does tax paperwork cost small firms?
- Federal paperwork cost small businesses over $81 billion in 2025 (SBA Office of Advocacy, Feb 2026).
- The IRS alone accounted for $66.0 billion of that cost and 1,568 million hours (SBA Office of Advocacy, Feb 2026).
For books and filings, see the bookkeeping contract page.
How do the self-employed save for retirement?
No employer sets up a plan for a self-employed owner, so the owner has to open one and fund it. The limits are high, and the tax return data shows how many owners use them.
What can an owner put away in 2026?
- The 401(k) employee deferral limit is $24,500, and the IRA limit is $7,500 (Internal Revenue Service, Nov 2025).
- The catch-up limit for people aged 50 and over in most 401(k) plans is $8,000 (Internal Revenue Service, Nov 2025).
- The defined contribution plan limit, which covers SEP and solo plans, is $72,000 for 2026 (Internal Revenue Service, Feb 2026).
- The compensation cap used to figure contributions is $360,000 for 2026 (Internal Revenue Service, Feb 2026).
- A SIMPLE plan salary reduction limit is $17,000 for 2026 (Internal Revenue Service, Feb 2026).
How many owners use those plans?
- The Keogh payments in tax year 2023 work out to about $31,850 per return by our division (Internal Revenue Service, Mar 2026).
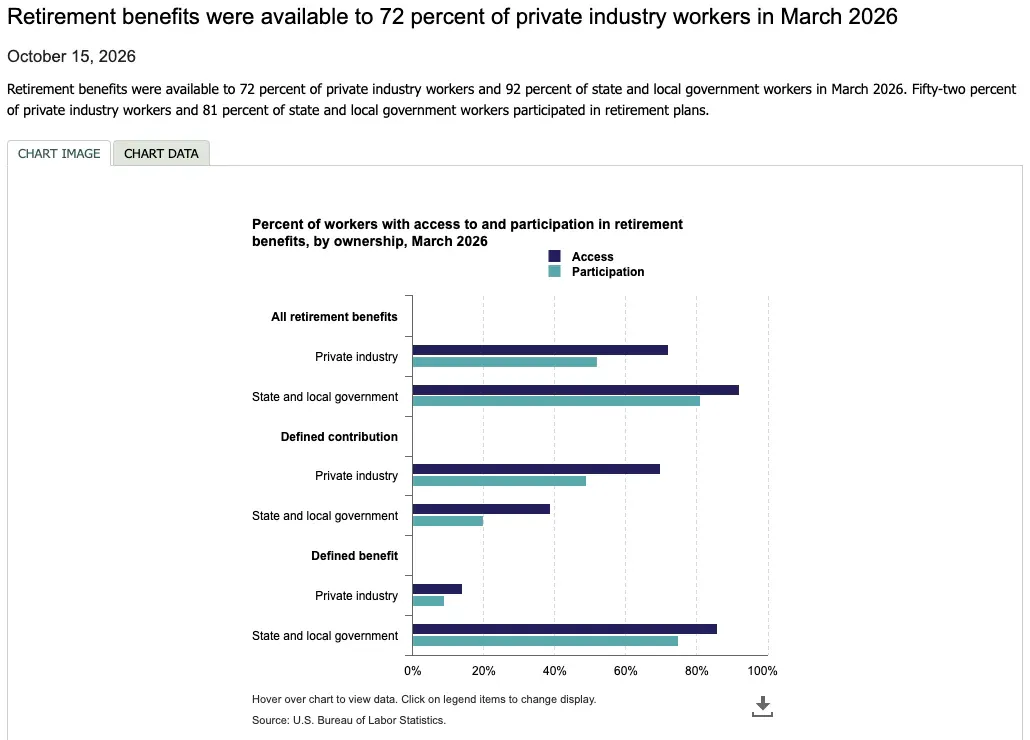
- Retirement benefits were available to 72% of private industry workers, and 52% took part (U.S. Bureau of Labor Statistics, Oct 2026).
- Defined contribution plans were open to 70% of private industry workers and 49% took part (U.S. Bureau of Labor Statistics, Oct 2026).
How do the self-employed get health coverage?
The self-employed buy their own cover, and the data shows it. The uninsured rate fell after the Marketplaces opened, but it is still above the rate for all adults.
How many self-employed adults are uninsured?
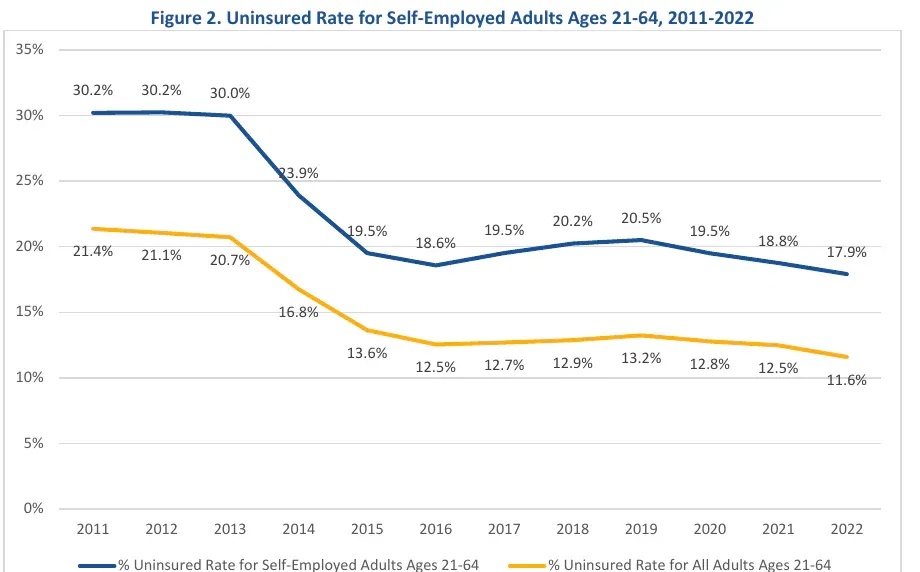
- The 2022 uninsured rate for all adults aged 21 to 64 was 11.6%, which is 6.3 points below the self-employed rate (HHS ASPE, Nov 2024).
- The rate for self-employed adults rose again to 20.5% in 2019 after falling to 18.6% in 2016 (HHS ASPE, Nov 2024).
- ASPE estimated from the 2022 American Community Survey that 16.3 million self-employed workers were aged 21 to 64, of whom 2.9 million were uninsured (HHS ASPE, Nov 2024).
- Self-employed workers were about 10% of all workers aged 21 to 64 (HHS ASPE, Nov 2024).
How much do owners rely on the Marketplaces?
- 18% of small business owners and self-employed workers had Marketplace coverage in 2022, against 6% of the rest of the population aged 21 to 64 (HHS ASPE, Nov 2024).
- 82% of them claimed a premium tax credit in 2022 (HHS ASPE, Nov 2024).
- Their share of Marketplace enrollment ran from 20% in Rhode Island to 41% in Hawaii (HHS ASPE, Nov 2024).
- 48% of adults under 65 with direct-purchase coverage worked for a small business with fewer than 25 workers, were self-employed or owned a small business, in KFF’s analysis of 2024 data (KFF, Sep 2025).
- 38% of individual market enrollees above 400% of the poverty line were self-employed, against 7% of all adults in that income range (KFF, Sep 2025).
- 3,595,764 returns claimed the self-employed health insurance deduction in tax year 2023, for $31.2 billion (Internal Revenue Service, Mar 2026).
How long do new businesses last, and what money problems do owners report?
Many new businesses close within a few years. The survey data also shows what goes wrong with cash while a business is open.
How many new businesses survive?
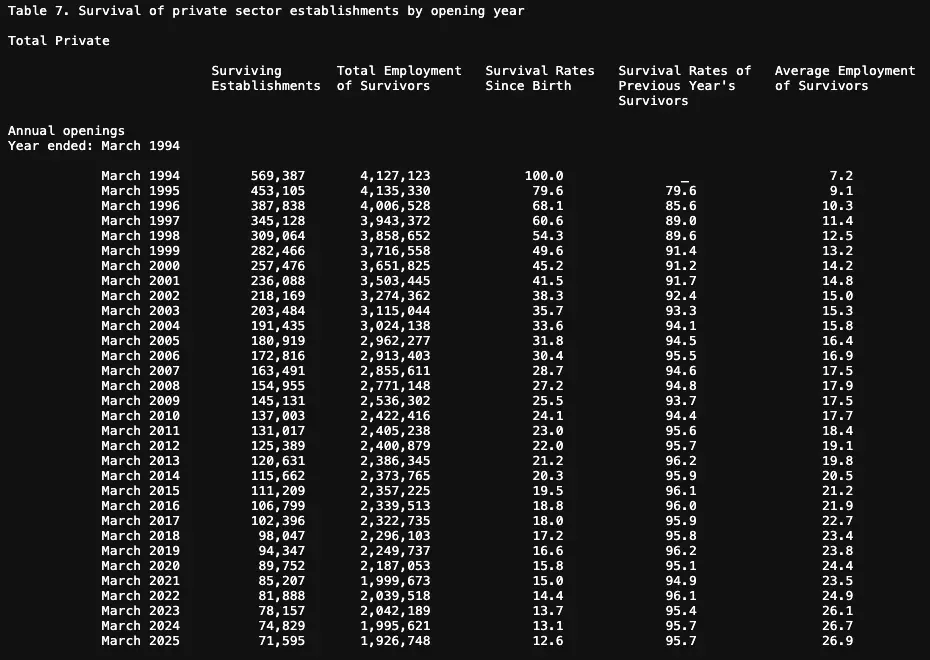
- Of the 1994 opening cohort, 79.6% remained after one year and 49.6% after five (U.S. Bureau of Labor Statistics, Mar 2025).
- 33.6% remained after ten years, 25.5% after fifteen and 12.6% after thirty-one (U.S. Bureau of Labor Statistics, Mar 2025).
- Retail trade kept 59.8% of its 2018 opening cohort for five years, the best of the sectors we checked (U.S. Bureau of Labor Statistics, Mar 2025).
- Professional, scientific and technical services kept 50.2%, the lowest of the sectors we checked (U.S. Bureau of Labor Statistics, Mar 2025).
- Health care and social assistance kept 57.6% of its 2018 cohort (U.S. Bureau of Labor Statistics, Mar 2025).
- Construction kept 56.2% of its 2018 cohort (U.S. Bureau of Labor Statistics, Mar 2025).
- 36.4% of sole proprietors without an employer ID number in 2018 were inactive or gone by 2019, against 20.3% of S corporations (U.S. Census Bureau, Sep 2025).
What financial problems do owners report?
- 53% of nonemployer firms named rising costs as a financial challenge, and 49% named weak sales (Federal Reserve Banks, Jul 2026).
- 45% named paying operating expenses and 29% named credit availability (Federal Reserve Banks, Jul 2026).
- Among employer firms, 50% named uneven cash flow, including collecting on receivables (Federal Reserve Banks, Mar 2026).
- Labor quality was the top single problem for 26% of small business owners in NFIB’s September 2026 survey, with inflation next at 20% (NFIB, Oct 2026).
For payment terms, see the payment plan contract page.
Methodology and Sources
We chose each figure from the agency, survey or regulator that produced it. We did not use roundups or third-party summaries. Each link goes to the primary document or data table, and each citation shows the month the data or page was published, or the end of the data period when no release month is stated. We refresh the page monthly and replace any figure that a newer release supersedes.
Several figures are our own divisions of published totals, such as average receipts per establishment and average net income per return, and the text marks each one. The Census Bureau flat file for 2024 nonemployer data is the source for all 2024 nonemployer counts and receipts. Sector rankings use the NAICS sectors as the source defines them. This page reports statistics and does not give legal or tax advice.
Glossary
- Nonemployer firm: a business with no paid employees, subject to federal income tax, with receipts of $1,000 or more.
- Employer firm: a business with at least one paid employee.
- Schedule C: the form where a sole proprietor reports business income and expenses.
- Self-employment tax: the Social Security and Medicare tax owed on net earnings from self-employment.
- SEP, SIMPLE, Keogh: retirement plans that a self-employed owner can open and fund.
- Qualified business income deduction: a deduction of up to 20 percent of qualified business income for eligible owners.
- NES: Census Bureau Nonemployer Statistics.
- SUSB: Census Bureau Statistics of US Businesses.
- BED: BLS Business Employment Dynamics.
- SBCS: Federal Reserve Small Business Credit Survey.
- SHED: Federal Reserve Survey of Household Economics and Decisionmaking.
- ASPE: the HHS Office of the Assistant Secretary for Planning and Evaluation.
- NFIB: National Federation of Independent Business.
Sources
Federal Reserve Banks
- 2026 Report on Employer Firms, data appendix (2025 Small Business Credit Survey)
- 2026 Chartbook on Nonemployer Firms (2025 Small Business Credit Survey)
- 2026 Chartbook on Nonemployer Firms, data appendix
Federal Reserve Board
HHS ASPE
Internal Revenue Service
- SOI Nonfarm Sole Proprietorship Statistics, Table 1, tax year 2023
- SOI Individual Statistical Tables, Table 1.4, tax year 2023
- Publication 5869, Tax Gap Projections for Tax Year 2022
- Tax Topic 554, Self-employment tax
- Estimated taxes
- Qualified business income deduction
- 401(k) limit increases to $24,500 for 2026, IRA limit increases to $7,500
- Publication 560, Retirement Plans for Small Business
KFF
NFIB
SBA Office of Advocacy
- Frequently Asked Questions About Small Business, February 2026
- 2025 Small Business Profile: United States
Social Security Administration
U.S. Bureau of Labor Statistics
- Current Population Survey, Table 15: Employed people in agriculture and nonagricultural industries by age, sex, and class of worker
- Employment Projections: Occupational projections and worker characteristics
- Business Employment Dynamics, Table 7: Survival of private sector establishments by opening year, total private
- Employment Situation, Table A-8: Employed people by class of worker and part-time status
- The Economics Daily: Retirement benefits were available to 72 percent of private industry workers in March 2026
- Business Employment Dynamics, Table 7, retail trade
- Business Employment Dynamics, Table 7, professional, scientific, and technical services
- Business Employment Dynamics, Table 7, health care and social assistance
- Business Employment Dynamics, Table 7, construction
U.S. Census Bureau
- 2024 Nonemployer Statistics, national flat file (nonemp24us)
- Number of U.S. Nonemployers Grew Faster Than Employer Businesses Nearly Every Year From 2012 to 2023
- CES Working Paper 25-60, nonemployer businesses and self-employment dynamics
- Telling the Story of the Nation’s Smallest Businesses
- Characteristics of Employer and Nonemployer Business Owners (ABS and NES-D)
- 2022 Statistics of U.S. Businesses (SUSB)